Ciudades y Futuro por Alejandro Gutierrez, Associate Director, ARUP Planning - Milán

ADVERTIMENT. Lʼaccés als continguts dʼaquesta tesi doctoral i la seva utilització ha de respectar els drets de lapersona autora. Pot ser utilitzada per a consulta o estudi personal, així com en activitats o materials dʼinvestigació idocència en els termes establerts a lʼart. 32 del Text Refós de la Llei de Propietat Intel·lectual (RDL 1/1996). Per altresutilitzacions es requereix lʼautorització prèvia i expressa de la persona autora. En qualsevol cas, en la utilització delsseus continguts caldrà indicar de forma clara el nom i cognoms de la persona autora i el títol de la tesi doctoral. Nosʼautoritza la seva reproducció o altres formes dʼexplotació efectuades amb finalitats de lucre ni la seva comunicaciópública des dʼun lloc aliè al servei TDX. Tampoc sʼautoritza la presentació del seu contingut en una finestra o marc alièa TDX (framing). Aquesta reserva de drets afecta tant als continguts de la tesi com als seus resums i índexs.
ADVERTENCIA. El acceso a los contenidos de esta tesis doctoral y su utilización debe respetar los derechos de lapersona autora. Puede ser utilizada para consulta o estudio personal, así como en actividades o materiales deinvestigación y docencia en los términos establecidos en el art. 32 del Texto Refundido de la Ley de PropiedadIntelectual (RDL 1/1996). Para otros usos se requiere la autorización previa y expresa de la persona autora. Encualquier caso, en la utilización de sus contenidos se deberá indicar de forma clara el nombre y apellidos de la personaautora y el título de la tesis doctoral. No se autoriza su reproducción u otras formas de explotación efectuadas con fineslucrativos ni su comunicación pública desde un sitio ajeno al servicio TDR. Tampoco se autoriza la presentación desu contenido en una ventana o marco ajeno a TDR (framing). Esta reserva de derechos afecta tanto al contenido dela tesis como a sus resúmenes e índices.
WARNING. The access to the contents of this doctoral thesis and its use must respect the rights of the author. It canbe used for reference or private study, as well as research and learning activities or materials in the terms establishedby the 32nd article of the Spanish Consolidated Copyright Act (RDL 1/1996). Express and previous authorization of theauthor is required for any other uses. In any case, when using its content, full name of the author and title of the thesismust be clearly indicated. Reproduction or other forms of for profit use or public communication from outside TDXservice is not allowed. Presentation of its content in a window or frame external to TDX (framing) is not authorized either.These rights affect both the content of the thesis and its abstracts and indexes.

DISSERTATION
A Decision Support System based on
Constraint Programming and Airspace
Digitalization for Cooperative Flight Departures
to improve ATM network service
competitiveness
A thesis submitted in partial fulfillment of the
requirements for the degree of
Doctor in Philosophy
Electrical and Telecommunication Engineering Program
Telecommunications and Systems Engineering Dept.
Universitat Autònoma de Barcelona
Barcelona, Spain
September 2018
Author:
Nina Rebecca Schefers
Thesis advisor:
Dr. Juan José Ramos González

2
©2018, Nina Rebecca Schefers

3
Dated: September 2018
Dr. Juan José Ramos González, Associate professor at the School of Engineering at
Universitat Autònoma de Barcelona,
CERTIFIES:
That the doctoral thesis entitled ”A Decision Support System based on Constraint
Programming and Airspace Digitalization for Cooperative Flight Departures to improve ATM network service competitiveness”, presented in partial fulfilment of the requirements for the reception of the degree of Doctor in Philosophy, embodies original
work done by Nina Rebecca Schefers under his supervision.
Research supervisor:
_______________________________________________
Dr. Juan José Ramos González
Logistics and Aeronautics Unit
Department of Telecommunications
and Systems Engineering
Universitat Autònoma de Barcelona


5
Dedication
Thank you to my family and friends who encouraged and supported me during all this
time and my academic adviser who inspired and guided me in this process.
-Nina Rebecca Schefers

6

7
Table of contents
I. List of tables ........................................................................................................................................ 8
II. List of figures ....................................................................................................................................... 9
III. List of acronyms ............................................................................................................................ 10
IV. Abstract ......................................................................................................................................... 11
V. Acknowledgements............................................................................................................................ 14
1. Introduction ....................................................................................................................................... 15
1.1. Introduction to ATM ................................................................................................................. 15
1.2. Introduction to Constraint Programming .................................................................................. 16
1.3. Technical background ............................................................................................................... 17
1.4. Motivation ................................................................................................................................. 19
1.5. Objectives ................................................................................................................................. 19
1.6. List of Publications ................................................................................................................... 20
1.7. Thesis structure ......................................................................................................................... 20
2. State of the Art ................................................................................................................................... 23
2.1. Metrics and Decision Support Tools in ATM ........................................................................... 23
2.1. Constraint Programming Models in ATM ................................................................................ 24
3. Methodology ...................................................................................................................................... 27
3.1. Detection Methodology ............................................................................................................ 27
3.2. Analysis methodology .............................................................................................................. 29
3.3. Mitigation Methodology ........................................................................................................... 32
3.4. Relationship to papers ............................................................................................................... 34
4. Application and experimental results................................................................................................. 35
4.1. Relationship to papers ............................................................................................................... 35
5. Paper 1 ............................................................................................................................................... 39
6. Paper 2 ............................................................................................................................................... 49
7. Paper 3 ............................................................................................................................................... 65
8. Paper 4 ............................................................................................................................................... 77
9. Conclusion and future research ........................................................................................................ 103
10. Bibliography ................................................................................................................................ 104
A. Appendix ......................................................................................................................................... 107

List of tables
8
I. List of tables
Table 1: Research Objectives ..................................................................................................................... 20
Table 2: CP data structure .......................................................................................................................... 33

List of figures
9
II. List of figures
Figure 1: Overview of the proposed concept .............................................................................................. 18
Figure 2: Modular structure of the tool ...................................................................................................... 19
Figure 3: 3D Multi-flight level mapping .................................................................................................... 28
Figure 4: Spatio-temporal interdependency registration ............................................................................ 29
Figure 5: Neighbourhood analysis .............................................................................................................. 29
Figure 6: Illustration of interdependencies using graph representation ...................................................... 30
Figure 7: Regrouping two pairwise conflicts to form one conflict node .................................................... 30
Figure 8: Two potential conflicts sharing aircraft 1 ................................................................................... 31
Figure 9: Independent clusters .................................................................................................................... 31
Figure 10: Concurrence interdependencies ................................................................................................ 31
Figure 11: Coupling Interdependencies ...................................................................................................... 32
Figure 12: Gantt diagrams showing the traffic through the cells with potential concurrence events, the
dagram shows the emerging conflict after inserting the departing traffic for the same time period. ............ 36
Figure 13: The diagram shows the conflict free solution after applying small adjustments on CTOT and
segment’ speed. .......................................................................................................................................... 36
Figure 14: Effects of time diversion on conflict window of the experiment ......................................... 37
Figure 15: Total detected CE and PCEs according to the applied cell size ................................................ 37
List of acronyms
10
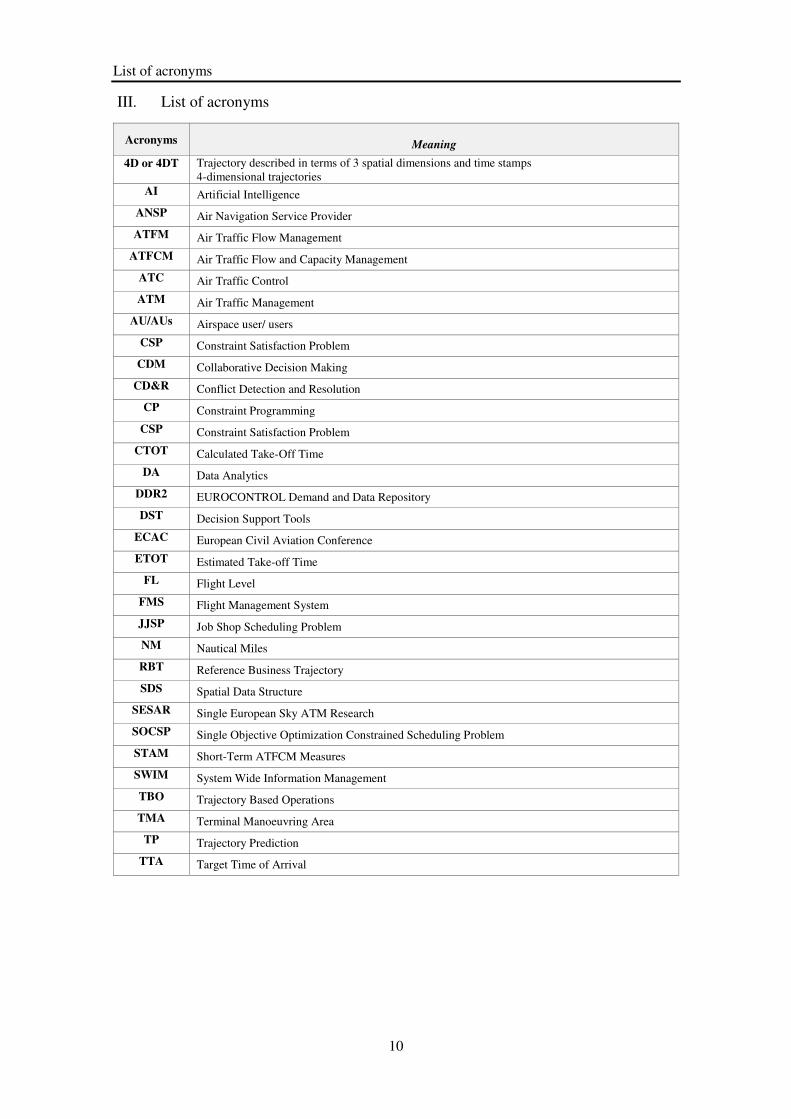
III. List of acronyms
Acronyms
Meaning
4D or 4DT Trajectory described in terms of 3 spatial dimensions and time stamps
4-dimensional trajectories
AI Artificial Intelligence
ANSP Air Navigation Service Provider
ATFM Air Traffic Flow Management
ATFCM Air Traffic Flow and Capacity Management
ATC Air Traffic Control
ATM Air Traffic Management
AU/AUs Airspace user/ users
CSP Constraint Satisfaction Problem
CDM Collaborative Decision Making
CD&R Conflict Detection and Resolution
CP Constraint Programming
CSP Constraint Satisfaction Problem
CTOT Calculated Take-Off Time
DA Data Analytics
DDR2 EUROCONTROL Demand and Data Repository
DST Decision Support Tools
ECAC European Civil Aviation Conference
ETOT Estimated Take-off Time
FL Flight Level
FMS Flight Management System
JJSP Job Shop Scheduling Problem
NM Nautical Miles
RBT Reference Business Trajectory
SDS Spatial Data Structure
SESAR Single European Sky ATM Research
SOCSP Single Objective Optimization Constrained Scheduling Problem
STAM Short-Term ATFCM Measures
SWIM System Wide Information Management
TBO Trajectory Based Operations
TMA Terminal Manoeuvring Area
TP Trajectory Prediction
TTA Target Time of Arrival

Abstract
11
IV. Abstract
Executive summary
The research work carried out in this dissertation proposes a new mechanism to apply a strategic shifting
of Estimated Take-Off Times within their Calculated Take-Off Time Windows to reduce the probability of
Air Traffic Controllers interventions.
This dissertation focuses on improving the air traffic dynamic demand capacity balance by using means of
the prompt identification of concurrence events at network level, the analysis of spatio-temporal
interdependencies and the mitigation of the detected concurrence events. These measures can be considered
as short-term Air Traffic Flow and Capacity Management (ATFCM) measures that could be applied at local
level that could reducing traffic peaks for the whole European airspace. The underlying philosophy is to
capitalise present freedom degrees between layered Air Traffic Management (ATM) planning tools that
sequence departures at airports. The work contributes to the well-accepted and widely spread research topic
Trajectory Based Operation (TBO) that enhances the design of new Decision Support Tools (DST). The
dissertation is aligned with a European H2020 Research project called “Partake”.
The main contributions of the Doctoral Thesis is the development and implementation of a consecutive
methodology for detecting concurrence events, analysing the trajectory interdependencies and using a
mitigation method based on Constraint Programming to determine the Estimated Take-Off Time shifts.
Furthermore, the doctoral thesis includes a strong experimental component focusing on validating the set
of tools and its application to a realistic scenario located in the London Terminal Manoeuvring Area.
This research topic follows to some extend my study background Logistics because the European Air
Traffic Management (ATM) system has to be competitive in the way to support the Airspace User (AU’s) demands up to a certain point e.g. satisfying the right time (e.g. departure slots), the right costs (e.g. suitable
level of Air Traffic Control (ATC) service), the right place (e.g. AU’s preferred trajectories) and the right service quality (e.g. safety) without extra investments, just by removing the ATM non-added-value
operations that indirectly impact on present ATM capacity. Furthermore, when looking at the explained
synchronization problem it follows a similar approach as the Job Shop Scheduling Problem that represents
a well-known optimization problem in the field of computer science, operation research and logistics by
considering the available airspace cells as the existing resource and the aircraft as the jobs that should be
performed requiring this resource.
Keywords: Air Traffic Management; Trajectory Based Operations; Decision Support Tool; Constraint
Programming; Uncertainties; Conflict Detection and Resolution; Reference Business Trajectories;

Abstract
12
Resumen Executivo
El trabajo de investigación llevado a cabo en esta disertación propone un nuevo mecanismo para aplicar un
cambio estratégico de tiempos estimados de despegue dentro de su ventana de tiempo de despegue
calculado para reducir la probabilidad de intervenciones de los controladores de tránsito aéreo.
Esta disertación se centra en mejorar el equilibrio de la capacidad de demanda dinámica del tráfico aéreo
mediante la identificación rápida de eventos de concurrencia a nivel de red, el análisis de las
interdependencias espacio-temporales y la mitigación de los eventos concurrentes detectados. Estas
medidas pueden considerarse como medidas a corto plazo de flujo de tráfico aéreo y gestión de la capacidad,
que podrían aplicarse a nivel local y podrían reducir los picos de tráfico en todo el espacio aéreo europeo.
La filosofía subyacente es capitalizar los grados de libertad presentes entre las herramientas de planificación
de la gestión del tráfico aéreo estratificadas que ordenan las salidas en los aeropuertos. El trabajo contribuye
al tema de investigación bien aceptado y ampliamente difundido “Trajectory Based Operation (TBO)” que
mejora el diseño de nuevas herramientas de soporte de decisiones. La disertación está alineada con un
proyecto europeo de investigación H2020 llamado "Partake".
Las principales contribuciones de la Tesis Doctoral es el desarrollo y la implementación de una metodología
consecutiva para detectar eventos de concurrencia, analizar las interdependencias de la trayectoria y utilizar
un método de mitigación basado en la Programación de Restricciones para determinar los turnos estimados
del tiempo de despegue. Además, la tesis doctoral incluye un fuerte componente experimental centrado en
la validación del conjunto de herramientas y su aplicación a un escenario realista ubicado en el Área de
maniobras del terminal de Londres.
Este tema de investigación sigue en cierta medida mi historial de estudios Logística porque el sistema de
Gestión del tránsito aéreo europeo tiene que ser competitivo en el camino para apoyar las demandas del
usuario del espacio aéreo hasta cierto punto, para satisfacer el tiempo correcto (por ejemplo, ranuras de
salida), los costos correctos (por ejemplo, nivel adecuado del servicio de control de tránsito aéreo), el lugar
correcto (por ejemplo, las trayectorias preferidas de usuarios del espacio aéreo) y la calidad de servicio
adecuada (por ejemplo, seguridad) sin inversiones eliminando las operaciones de valor agregado sin cajero
automático que tienen un impacto indirecto en la capacidad actual del cajero automático. Además, al
analizar el problema de sincronización explicado, sigue un enfoque similar al problema de programación
de taller que representa un problema de optimización bien conocido en el campo de la informática, la
investigación operativa y la logística considerando las celdas de espacio aéreo disponibles como el recurso
existente y el avión como los trabajos que se deben realizar que requieren este recurso.
Palabras clave: Air Traffic Management; Trajectory Based Operations; Decision Support Tool; Constraint
Programming; Uncertainties; Conflict Detection and Resolution; Reference Business Trajectories;
Abstract
13
Resum executiu
El treball de recerca dut a terme en aquesta tesi proposa un nou mecanisme per aplicar un desplaçament
estratègic dels temps estimats enlairament dins del seu temps de desplaçament calculat finestra de temps
per reduir la probabilitat d'intervencions de controladors de trànsit aeri.
Aquesta tesi es centra en la millora del saldo dinàmic de la demanda de trànsit aeri mitjançant l'ús de la
identificació ràpida d'esdeveniments concurrents a nivell de xarxa, l'anàlisi de les interdependències espai-
temporals i la mitigació dels esdeveniments de concurrència detectats. Aquestes mesures es poden
considerar com a mesures a curt termini per a l'administració de cabal i de capacitat de trànsit aeri, que
podrien aplicar-se a nivell local que podria reduir els pics de trànsit de tot l'espai aeri europeu. La filosofia
subjacent és aprofitar els graus de llibertat actual entre les eines de planificació de la gestió del trànsit aeri
(capes aeronàutiques) en capes que ordenen sortides als aeroports. El treball contribueix al tema de recerca
ben acceptat i àmpliament difós Trajectòria basada en l'operació que millora el disseny de noves eines de
suport a la decisió. La dissertació està alineada amb un projecte europeu H2020 Research anomenat
"Partake".
Les principals contribucions de la tesi doctoral són el desenvolupament i implementació d'una metodologia
consecutiva per detectar esdeveniments de concurrència, analitzar les interdependències de la trajectòria i
utilitzar un mètode de mitigació basat en la Programació de restriccions per determinar els desplaçaments
estimats del temps d'eliminació. A més, la tesi doctoral inclou un fort component experimental que es centra
en validar el conjunt d'eines i la seva aplicació a un escenari realista ubicat a l'àrea de maniobra de Terminal
de Londres.
Aquest tema de recerca segueix una mica més el meu fons d'estudis de logística perquè el sistema European
Air Traffic Management (ATM) ha de ser competitiu en la manera de donar suport a les demandes de
l'usuari de l'espai aeri fins a un cert punt, p. satisfent el moment adequat (per exemple, tragamonedas de
sortida), els costos correctes (per exemple, el nivell adequat del servei de control de trànsit aeri, el lloc
adequat (per exemple, les trajectòries preferides l'usuari de l'espai aeri) i la qualitat del servei adequada (per
exemple, seguretat) sense inversions addicionals. eliminant les operacions de valor no agregat d'ATM que
afecten indirectament la capacitat actual de l'ATM. A més, quan es mira el problema de sincronització
explicat, segueix un enfocament similar al Problema de programació de la botiga de treball que representa
un problema d'optimització conegut en el camp de la informàtica, la investigació operativa i la logística,
considerant les cel·les de l'espai aeri disponibles com a recurs existent i l'avió com els llocs de treball que
s'han de realitzar amb aquest recurs.
Paraules clau: Air Traffic Management; Trajectory Based Operations; Decision Support Tool; Constraint
Programming; Uncertainties; Conflict Detection and Resolution; Reference Business Trajectories;

Acknowledgements
14
V. Acknowledgements
I would like to express my gratitude to all those, who helped me during the whole PhD research.
The PhD Program was an intensive period of intense learning and investigation that has had a great impact
on me. I would like to express my deepest gratitude to my thesis supervisor Dr. Juan José Ramos González
who has encouraged and led me into the academic world. Thank you for your help, patience and consistence
encouragement with Constraint Programming and for giving me the opportunity to participate in a very
challenging and interesting European project. I have learned a lot during the last years and I appreciate your
dedication, feedbacks and guidance to achieve my research goals.
The decision to stay more years in a foreign country has not always been easy but looking back it has helped
me to transform myself into a citizen of the world. I am beyond grateful for my family and my friends for
accepting the distance and giving me the unconditional support and love that was necessary for this journey.
Special thanks must be given to all members of the PARTAKE project. The close collaboration was very
pleasant and inspiring, and the dedication of all team members was a great contribution to the success.
Furthermore, I would like to thank the professors and members of the Department of Telecommunication
and System Engineering, and all the staff of the campus of Sabadell who, at all times, were very welcoming,
helpful in explaining administrative issues and always had an open ear. Thimjo and Marsel who cheered up
the sometimes solitary every-day PhD life on Campus Sabadell in every possible way. Some very special
thanks go to Dr. Jenaro Nosedal for introducing me to the aviation world and Marko Radanovic for being
a perfect partner in crime.
Likewise, I want to convey my gratitude to the Doctoral School of the UAB. This thesis would have never
been possible without the PhD research scholarship that has founded me. Also, I have been lucky to have
had the support of Dr. Angel A. Juan who has encouraged me to start a PhD after my LSCM Master.
Finally, I would like to thank those, who made me feel at home while being abroad. Thank you for your
friendship and the good memories.
Barcelona,
September 2018
Nina Schefers

Introduction
15
Chapter 1
1. Introduction
Europe has some of the busiest airspace in the world, compiled from 44-member states united in the
European Civil Aviation Conference (ECAC) region (ECAC 2017). To safely operate the demand, an Air
Traffic Flow and Capacity Management (ATFCM) service has been established to use the given capacity
to the maximum extent possible keeping in mind the guiding principles safety, continuity and expeditious
for the flow of air traffic.
The main research objective of this dissertation is to reduce the probability of ATC tactical interventions
due to conflicting aircraft, by developing a TBO-oriented methodology, based on identifying trajectory
interdependencies and determining feasible multi-airport departure configurations that relax them. The
underlying philosophy capitalises tactical flexibility of take-off times when managing departures in a multi-
airport system by considering the downstream benefits of small changes on them.
To address the research objectives, first, the operational environment and the scientific foundations are
explained to highlight what is the research context. Therefore, the operational environment includes an
introduction to the ATM system and a scientific background that presents an introduction to Constraint
Programming formalism. In a next step, the technical background reveals how the problem was solved by
explaining the modular structure of the designed tools.
1.1. Introduction to ATM
The ATM System is understood as a holistic entity consisting of seven ATM conceptual components:
Airspace organization and management
Demand/capacity balancing
Aerodrome operations
Traffic synchronization
Conflict management
Airspace user operations
ATM service delivery management
In order to have a well-functioning ATM system, all these components have to be present and properly
integrated. In addition to the seven concept components, the exchange and management of information
used by the different processes and services is of great importance.
Furthermore, the airspace organization and management provide the strategies, rules and procedures by
which the airspace will be structured to accommodate the different types of air activity, volume of traffic,
and different levels of service and rules of conduct. These management activities are underlined by the
demand and capacity balancing that can be divided into strategic-, pre-tactical-, and tactical stages.
The problem of fitting the maximum number of aircraft into ATC sectors, keeping in mind aircraft
separation and safety standards, area navigation direct routings and other factors, is known as the airspace
capacity problem. Above the European airspace, a high-density network of air traffic can be found which
is determined by the workload of controllers.
In Europe, an Air Traffic Flow Management (ATFM) service has been established to use the given capacity
to the maximum extent possible keeping in mind the guiding principles safety, continuity and expeditious
for the flow of air traffic. Demand and Capacity Balancing (DCB) strategically evaluates system-wide
traffic flows and aerodrome capacities to allow Airspace Users (AUs) to determine when, where and how
they operate, while mitigating conflicting needs to improve airspace and aerodrome capacity. This
Introduction
16
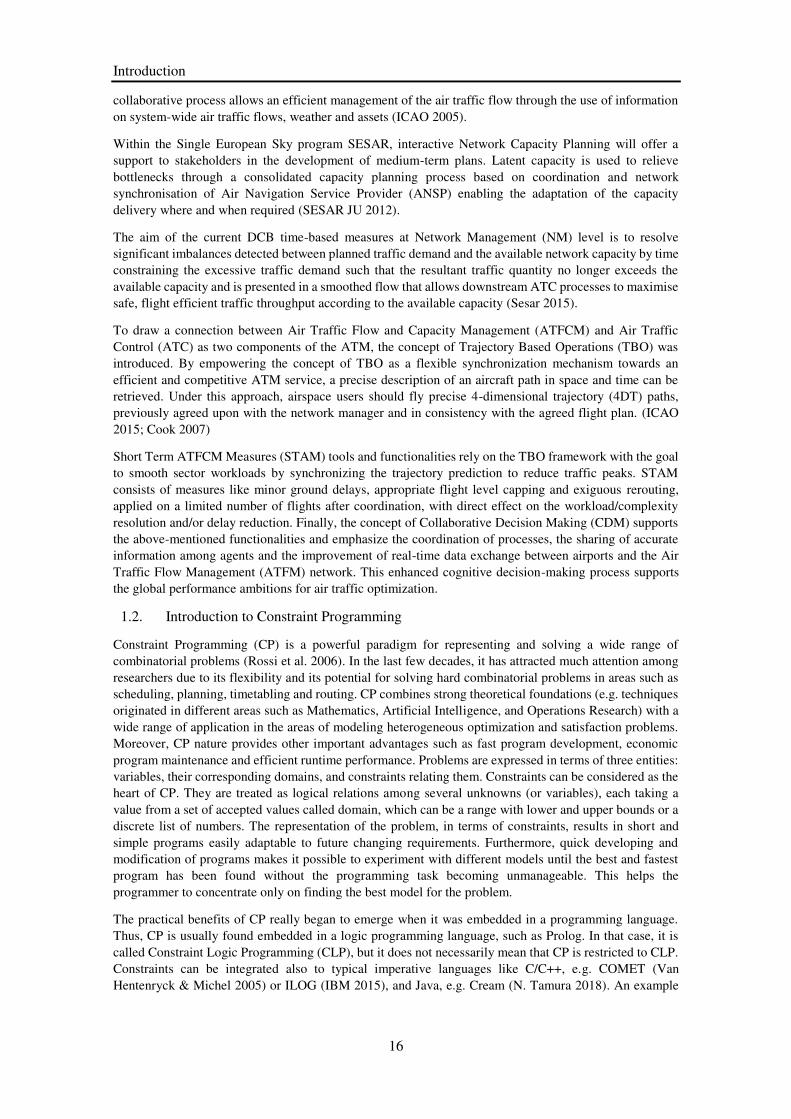
collaborative process allows an efficient management of the air traffic flow through the use of information
on system-wide air traffic flows, weather and assets (ICAO 2005).
Within the Single European Sky program SESAR, interactive Network Capacity Planning will offer a
support to stakeholders in the development of medium-term plans. Latent capacity is used to relieve
bottlenecks through a consolidated capacity planning process based on coordination and network
synchronisation of Air Navigation Service Provider (ANSP) enabling the adaptation of the capacity
delivery where and when required (SESAR JU 2012).
The aim of the current DCB time-based measures at Network Management (NM) level is to resolve
significant imbalances detected between planned traffic demand and the available network capacity by time
constraining the excessive traffic demand such that the resultant traffic quantity no longer exceeds the
available capacity and is presented in a smoothed flow that allows downstream ATC processes to maximise
safe, flight efficient traffic throughput according to the available capacity (Sesar 2015).
To draw a connection between Air Traffic Flow and Capacity Management (ATFCM) and Air Traffic
Control (ATC) as two components of the ATM, the concept of Trajectory Based Operations (TBO) was
introduced. By empowering the concept of TBO as a flexible synchronization mechanism towards an
efficient and competitive ATM service, a precise description of an aircraft path in space and time can be
retrieved. Under this approach, airspace users should fly precise 4-dimensional trajectory (4DT) paths,
previously agreed upon with the network manager and in consistency with the agreed flight plan. (ICAO
2015; Cook 2007)
Short Term ATFCM Measures (STAM) tools and functionalities rely on the TBO framework with the goal
to smooth sector workloads by synchronizing the trajectory prediction to reduce traffic peaks. STAM
consists of measures like minor ground delays, appropriate flight level capping and exiguous rerouting,
applied on a limited number of flights after coordination, with direct effect on the workload/complexity
resolution and/or delay reduction. Finally, the concept of Collaborative Decision Making (CDM) supports
the above-mentioned functionalities and emphasize the coordination of processes, the sharing of accurate
information among agents and the improvement of real-time data exchange between airports and the Air
Traffic Flow Management (ATFM) network. This enhanced cognitive decision-making process supports
the global performance ambitions for air traffic optimization.
1.2. Introduction to Constraint Programming
Constraint Programming (CP) is a powerful paradigm for representing and solving a wide range of
combinatorial problems (Rossi et al. 2006). In the last few decades, it has attracted much attention among
researchers due to its flexibility and its potential for solving hard combinatorial problems in areas such as
scheduling, planning, timetabling and routing. CP combines strong theoretical foundations (e.g. techniques
originated in different areas such as Mathematics, Artificial Intelligence, and Operations Research) with a
wide range of application in the areas of modeling heterogeneous optimization and satisfaction problems.
Moreover, CP nature provides other important advantages such as fast program development, economic
program maintenance and efficient runtime performance. Problems are expressed in terms of three entities:
variables, their corresponding domains, and constraints relating them. Constraints can be considered as the
heart of CP. They are treated as logical relations among several unknowns (or variables), each taking a
value from a set of accepted values called domain, which can be a range with lower and upper bounds or a
discrete list of numbers. The representation of the problem, in terms of constraints, results in short and
simple programs easily adaptable to future changing requirements. Furthermore, quick developing and
modification of programs makes it possible to experiment with different models until the best and fastest
program has been found without the programming task becoming unmanageable. This helps the
programmer to concentrate only on finding the best model for the problem.
The practical benefits of CP really began to emerge when it was embedded in a programming language.
Thus, CP is usually found embedded in a logic programming language, such as Prolog. In that case, it is
called Constraint Logic Programming (CLP), but it does not necessarily mean that CP is restricted to CLP.
Constraints can be integrated also to typical imperative languages like C/C++, e.g. COMET (Van
Hentenryck & Michel 2005) or ILOG (IBM 2015), and Java, e.g. Cream (N. Tamura 2018). An example
Introduction
17
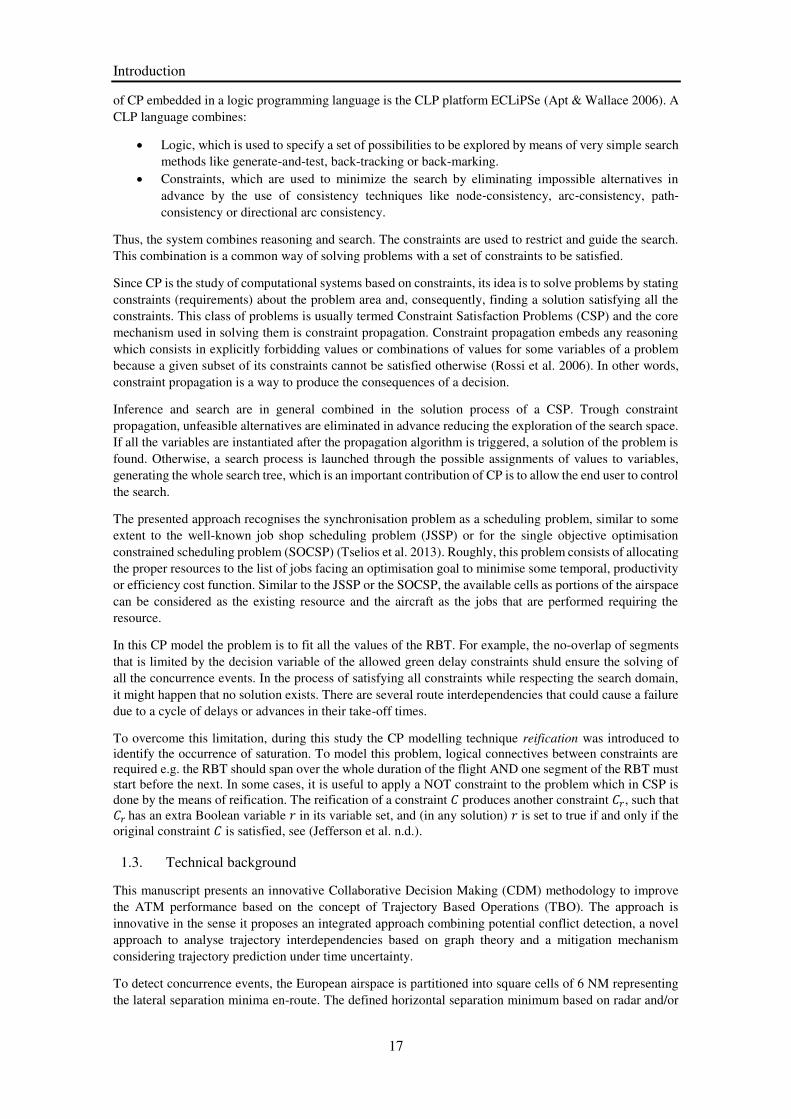
of CP embedded in a logic programming language is the CLP platform ECLiPSe (Apt & Wallace 2006). A
CLP language combines:
Logic, which is used to specify a set of possibilities to be explored by means of very simple search
methods like generate-and-test, back-tracking or back-marking.
Constraints, which are used to minimize the search by eliminating impossible alternatives in
advance by the use of consistency techniques like node‐consistency, arc‐consistency, path‐ consistency or directional arc consistency.
Thus, the system combines reasoning and search. The constraints are used to restrict and guide the search.
This combination is a common way of solving problems with a set of constraints to be satisfied.
Since CP is the study of computational systems based on constraints, its idea is to solve problems by stating
constraints (requirements) about the problem area and, consequently, finding a solution satisfying all the
constraints. This class of problems is usually termed Constraint Satisfaction Problems (CSP) and the core
mechanism used in solving them is constraint propagation. Constraint propagation embeds any reasoning
which consists in explicitly forbidding values or combinations of values for some variables of a problem
because a given subset of its constraints cannot be satisfied otherwise (Rossi et al. 2006). In other words,
constraint propagation is a way to produce the consequences of a decision.
Inference and search are in general combined in the solution process of a CSP. Trough constraint
propagation, unfeasible alternatives are eliminated in advance reducing the exploration of the search space.
If all the variables are instantiated after the propagation algorithm is triggered, a solution of the problem is
found. Otherwise, a search process is launched through the possible assignments of values to variables,
generating the whole search tree, which is an important contribution of CP is to allow the end user to control
the search.
The presented approach recognises the synchronisation problem as a scheduling problem, similar to some
extent to the well-known job shop scheduling problem (JSSP) or for the single objective optimisation
constrained scheduling problem (SOCSP) (Tselios et al. 2013). Roughly, this problem consists of allocating
the proper resources to the list of jobs facing an optimisation goal to minimise some temporal, productivity
or efficiency cost function. Similar to the JSSP or the SOCSP, the available cells as portions of the airspace
can be considered as the existing resource and the aircraft as the jobs that are performed requiring the
resource.
In this CP model the problem is to fit all the values of the RBT. For example, the no-overlap of segments
that is limited by the decision variable of the allowed green delay constraints shuld ensure the solving of
all the concurrence events. In the process of satisfying all constraints while respecting the search domain,
it might happen that no solution exists. There are several route interdependencies that could cause a failure
due to a cycle of delays or advances in their take-off times.
To overcome this limitation, during this study the CP modelling technique reification was introduced to
identify the occurrence of saturation. To model this problem, logical connectives between constraints are
required e.g. the RBT should span over the whole duration of the flight AND one segment of the RBT must
start before the next. In some cases, it is useful to apply a NOT constraint to the problem which in CSP is
done by the means of reification. The reification of a constraint produces another constraint , such that
has an extra Boolean variable in its variable set, and (in any solution) is set to true if and only if the
original constraint is satisfied, see (Jefferson et al. n.d.).
1.3. Technical background
This manuscript presents an innovative Collaborative Decision Making (CDM) methodology to improve
the ATM performance based on the concept of Trajectory Based Operations (TBO). The approach is
innovative in the sense it proposes an integrated approach combining potential conflict detection, a novel
approach to analyse trajectory interdependencies based on graph theory and a mitigation mechanism
considering trajectory prediction under time uncertainty.
To detect concurrence events, the European airspace is partitioned into square cells of 6 NM representing
the lateral separation minima en-route. The defined horizontal separation minimum based on radar and/or

Introduction
18
ADS-B and/or MLAT system according to ICAO Doc 4444 (ICAO, 2016) is set to 5 NM. In this work, the
horizontal separation is set to 6 NM to take into account any lateral deviations with respect to the RBT
below 1 NM. It is worth to mention that the cell size is a parameter that might be changed depending on
the operational context (e.g. in TMA the cell size can be set to 3NM).
A concurrence event occurs when two or more aircraft loose separation minima (vertical or horizontal).
The presented approach solves the existing concurrence events applying time shifts to some of the flights.
However, this aircraft take-off times shifts can generate additional concurrence events, which are called
potential concurrence events. Hence for the mitigation phase the potential concurrence events, that produce
critical spatio-temporal interdependencies between pairs of aircraft, must be detected.
Figure 1 illustrates the concept and shows potential concurrence events that are detected by analysing the
spatiotemporal interdependencies between flights sharing the same airspace. To mitigate the concurrence
events, the trajectories are shifted using slight ETOT modifications and bounded speed adjustments in such
a way that a clearance is achieved.
Figure 1: Overview of the proposed concept
This work shows the set of tools to determine small Estimated Take-Off Time (ETOT) adjustments within
the [−5,10] minute interval along with bounded modifications on the flight duration as control actions. These actions will be calculated to mitigate the potential tight trajectory interdependencies on a multi-flight
level that can emerge after inserting the traffic ready to depart.
The proposed methodology is composed of three main functionalities:
1. Detection: The detection functionality identifies the concurrence events and it is split into two sub-
modules: the mapping process and the filtering process.
2. Analysis: The analysis functionality refers to the identification of topologies of interdependencies
that cannot be removed by ground delays constrained by the CTOT time-window. This analysis
will be helpful for identifying the trajectories that should be removed from the problem
formulation in the mitigation functionality to provide a robust departure coordination.
3. Mitigation: Finally, the mitigation functionality calculates feasible time stamp domains
considering multi-objective criteria to resolve the trajectory clusters.
The modular structure proposed for the development of the tools and their associated algorithms is depicted
in Figure 2.
6NM
6N
M
Overlap at cell
Loss of separation minima
(Concurrence Event)
Clearance at cell
Maximize minimum clearance
S2’
S1 S2
Mitigation actions
Airspace discretization
TimeShiftingBounded Speed
Adjustment

Introduction
19
Figure 2: Modular structure of the tool
1.4. Motivation
The motivation of this thesis derives from the Air Traffic Management (ATM) Master Plan that was
introduced by (SESAR 2017) to summarize essential operational and technological changes to deliver the
essential contributions for the Single European Sky performance objectives (Sesar 2015). Under the
framework of the TBO concept, the intention of this innovative approach is to design a competitive ATM
system supporting up to a certain extent the Airspace User (AU) demands at the right time (i.e. departure
slots), at the right cost (i.e. suitable level of Air Traffic Control (ATC) service) at the right place (i.e. AU’s preferred trajectories) and at the right service quality (i.e. safety) without extra investments, just by
removing the ATM non-added-value operations that indirectly impact on the present ATM capacity.
Aligned with the ATM mission to preserve and even improve the maximum level of safety, while achieving
the maximum levels of efficiency and resilience it is broadly recognized that these challenges can only be
obtained by improving the current levels of predictability and flexibility, provided by the ATM planning
layers. Furthermore, AU’ s shall know that any change in their initial intentions is always done to maximise
the overall system efficiency driven by fairness and equity criterion. This can only be understood by the
highest level of transparency.
The methodology aims to improve the present demand and capacity balance in ATM by introducing small
ground delays in the programmed departure. The planned traffic is not affected since the slot time window
assigned to each aircraft will be preserved. This approach allows to design a flexible TBO synchronization
mechanism that preserves ATFM constraints. Furthermore, the mechanism intents to support the innovation
of complexity metrics in regulation processes using advanced technologies with the aim to reduce the
probability of ATC tactical interventions.
1.5. Objectives
The doctoral dissertation implements a set of tools to determine small Calculated Take-Off Time (CTOT)
adjustments within the determined time-frame. Based on bibliographic sources and the research carried out,
the following key research objectives of this dissertation have been defined:
Objective Work carried out for objectives’ achievement 1.
Generation of operational
constrains for cooperative
aircraft departures using
Constraint Programming
formalism.
Development of the CP model to determine feasible departure
configurations considering time uncertainty
Implementation of the optimization model
Introduction
20
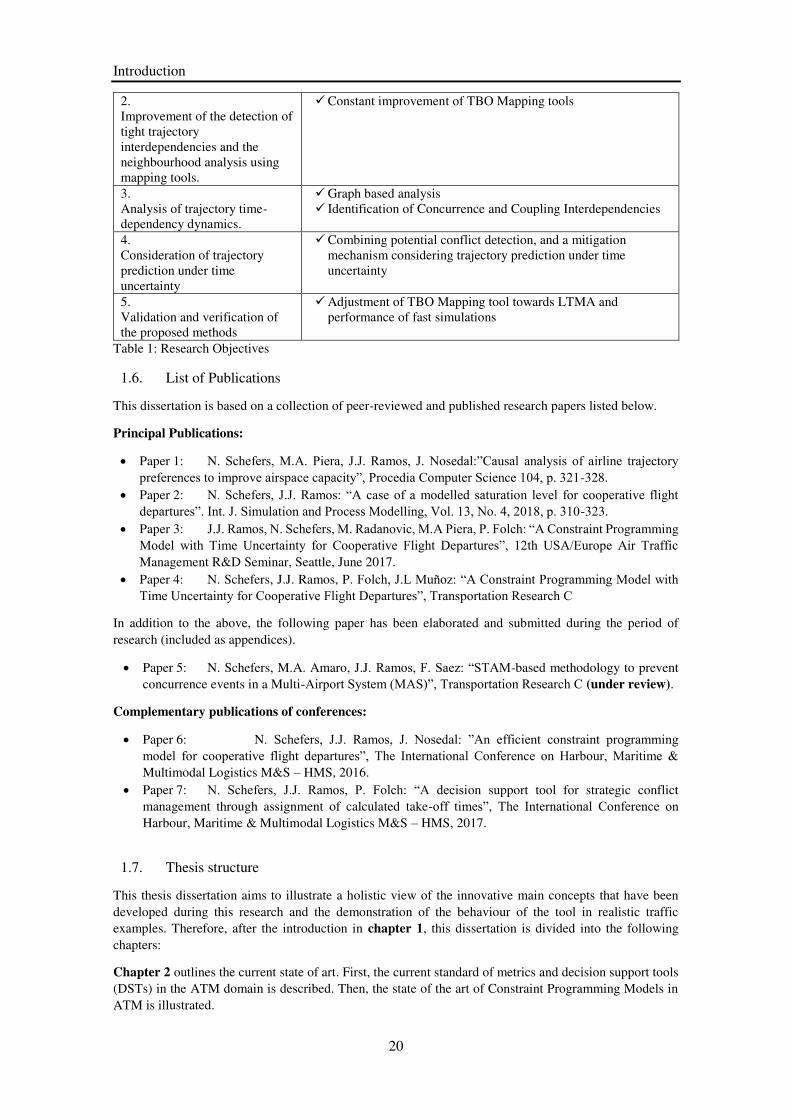
2.
Improvement of the detection of
tight trajectory
interdependencies and the
neighbourhood analysis using
mapping tools.
Constant improvement of TBO Mapping tools
3.
Analysis of trajectory time-
dependency dynamics.
Graph based analysis
Identification of Concurrence and Coupling Interdependencies
4.
Consideration of trajectory
prediction under time
uncertainty
Combining potential conflict detection, and a mitigation
mechanism considering trajectory prediction under time
uncertainty
5.
Validation and verification of
the proposed methods
Adjustment of TBO Mapping tool towards LTMA and
performance of fast simulations
Table 1: Research Objectives
1.6. List of Publications
This dissertation is based on a collection of peer-reviewed and published research papers listed below.
Principal Publications:
Paper 1: N. Schefers, M.A. Piera, J.J. Ramos, J. Nosedal:”Causal analysis of airline trajectory preferences to improve airspace capacity”, Procedia Computer Science 104, p. 321-328.
Paper 2: N. Schefers, J.J. Ramos: “A case of a modelled saturation level for cooperative flight departures”. Int. J. Simulation and Process Modelling, Vol. 13, No. 4, 2018, p. 310-323.
Paper 3: J.J. Ramos, N. Schefers, M. Radanovic, M.A Piera, P. Folch: “A Constraint Programming
Model with Time Uncertainty for Cooperative Flight Departures”, 12th USA/Europe Air Traffic Management R&D Seminar, Seattle, June 2017.
Paper 4: N. Schefers, J.J. Ramos, P. Folch, J.L Muoz: “A Constraint Programming Model with Time Uncertainty for Cooperative Flight Departures”, Transportation Research C
In addition to the above, the following paper has been elaborated and submitted during the period of
research (included as appendices).
Paper 5: N. Schefers, M.A. Amaro, J.J. Ramos, F. Saez: “STAM-based methodology to prevent
concurrence events in a Multi-Airport System (MAS)”, Transportation Research C (under review).
Complementary publications of conferences:
Paper 6: N. Schefers, J.J. Ramos, J. Nosedal: ”An efficient constraint programming model for cooperative flight departures”, The International Conference on Harbour, Maritime & Multimodal Logistics M&S – HMS, 2016.
Paper 7: N. Schefers, J.J. Ramos, P. Folch: “A decision support tool for strategic conflict
management through assignment of calculated take-off times”, The International Conference on Harbour, Maritime & Multimodal Logistics M&S – HMS, 2017.
1.7. Thesis structure
This thesis dissertation aims to illustrate a holistic view of the innovative main concepts that have been
developed during this research and the demonstration of the behaviour of the tool in realistic traffic
examples. Therefore, after the introduction in chapter 1, this dissertation is divided into the following
chapters:
Chapter 2 outlines the current state of art. First, the current standard of metrics and decision support tools
(DSTs) in the ATM domain is described. Then, the state of the art of Constraint Programming Models in
ATM is illustrated.

Introduction
21
Relationship to paper: N. Schefers, M.A. Piera, J.J. Ramos, J. Nosedal:”Causal analysis of airline trajectory preferences to improve airspace capacity”, Procedia Computer Science 104, p. 321-328.
As an answer to the previous mentioned research objectives, various tools were developed during this
research corresponding to main functionalities (see Figure 2). Chapter 3 presents the methodology of the
tools. The description of the methodology in chapter 3 is divided as follows:
1. Conflict detection process: based on trajectories information, aircraft positions are mapped to a
spatial data structure that will help the filtering and detection of trajectory interdependencies, as
well as the temporal looseness at these intersections.
Relationship to paper:
N. Schefers, J.J. Ramos: “A case of a modelled saturation level for cooperative flight departures”. Int. J. Simulation and Process Modelling, Vol. 13, No. 4, 2018, p. 310-323.
N. Schefers, J.J. Ramos, P. Folch, J.L Muoz: “A Constraint Programming Model with Time Uncertainty for Cooperative Flight Departures”, Transportation Research C
2. Analysis process: the previous trajectory interdependencies are analysed using graph theory to
define a set of independent sub-graphs and to be able to determine concurrence and coupling
interdependencies.
Relationship to paper:
N. Schefers, J.J. Ramos, P. Folch: “A decision support tool for strategic conflict management through assignment of calculated take-off times”, The International Conference on Harbour, Maritime &
Multimodal Logistics M&S – HMS, 2017.
N. Schefers, M.A. Amaro, J.J. Ramos, F. Saez: “STAM-based methodology to prevent concurrence
events in a Multi-Airport System (MAS)”, Transportation Research C (under review).
3. Fine take-off scheduling (mitigation) process: using a Constraint Programming paradigm,
trajectories and interdependencies constraints are processed to find a slightly modified take-off
schedule that will reduce the number of ATC interventions.
Relationship to paper:
N. Schefers, J.J. Ramos: “A case of a modelled saturation level for cooperative flight departures”. Int. J. Simulation and Process Modelling, Vol. 13, No. 4, 2018, p. 310-323.
N. Schefers, J.J. Ramos, P. Folch, J.L Muoz: “A Constraint Programming Model with Time Uncertainty for Cooperative Flight Departures”, Transportation Research C.
Chapter 4 shows the application of the tool and discusses the experimental results that have been obtained.
Relationship to paper:
N. Schefers, M.A. Amaro, J.J. Ramos, F. Saez: “STAM-based methodology to prevent concurrence
events in a Multi-Airport System (MAS)”, Transportation Research C (under review).
N.Schefers, J.J. Ramos, P.Folch, J.L Muoz: “A Constraint Programming Model with Time
Uncertainty for Cooperative Flight Departures”, Transportation Research C.
N. Schefers, J.J. Ramos: “A case of a modelled saturation level for cooperative flight departures”. Int. J. Simulation and Process Modelling, Vol. 13, No. 4, 2018, p. 310-323.
Moreover, chapter 5-8 present the research papers and make the connection to the approaches and
methodologies presented in chapter 1-4.
Finally, in chapter 9 the conclusions and future research fields are summarized.

Introduction
22

State of the Art
23
Chapter 2
2. State of the Art
2.1. Metrics and Decision Support Tools in ATM
The research sector of Conflict Detection and Resolution has undergone a paradigm shift from tactical to
strategic ATC with the introduction of the 4D-TBO concept, representing the current state of the art of this
research sector. Instead of adjusting flights just in time, the overall flight performance can be improved
significantly by performing more efficient avoidance manoeuvres assuming proper forecasts (Kuenz,
2015). The benefit of the TBO concept is an accurate 4-dimensional trajectory (3 spatial dimensions and
time) the aircraft will fly. The details of the trajectory will be shared by all involved parties through System
Wide Information Management (SWIM). Also, intervention in the trajectory will happen in full knowledge
of the downstream effects as shown in (Nosedal et al., 2015) and hence it will be possible to pick the option
causing the minimum amount of trajectory distortion. Finally, the removal of most uncertainties around the
trajectory, using Artificial Intelligence (AI) and Data Analytics (DA) such as predictive analytics, makes it
possible to improve the airspace volume as stated in (Wilco, 2017).
Researchers have used the advantages of the 4D-TBO concept and studied, among other, conflict detection
and separation observance approach as in (Ruiz, Piera and Del Pozo, 2013; Ruiz et al., 2014) or strategic
trajectory planning approaches with uncertainty as in (Chaimatanan, Delahaye and Mongeau, 2018).
Efficient High-Performance Conflict Detection and Resolution methods have been developed in (Kuenz,
2015) for large traffic scenarios based on an N-dimensional bisection of airspace allowing a significant
reduction of complexity using the TBO concept. An initial potential conflict detection approach based on
the partitioning of the airspace has been proposed by (Nosedal et al., 2014), which serves as the baseline
for the present work. The work presented in this paper introduces major contributions both in detection and
mitigation mechanisms with respect to the methods proposed in (Nosedal et al., 2014). As to detection
mechanisms these contributions can be summarized as follows: a 3D cell-grid based method is introduced
for the 4D trajectory digitalization and an intelligent pairwise analysis is implemented to avoid false
negatives in the detection of the traffic through each neighbouring cell. The proposed 3D discretization
enables the representation of the trajectories from departure to arrival. From the methodological
perspective, full 4D trajectories are processed and the analysis is not limited to a particular phase of the
flights; from the applicability perspective, the proposed technique extends its usability to TMA and not just
to en-route traffic; from the practicality perspective, the technical implementation of mapping and detection
processes scales to different operational contexts, with different criteria for vertical and lateral separation.
Regarding the mitigation mechanisms, the model has been totally reformulated while preserving the basic
idea of the CTOT shifting to remove conflicts. In summary, the Constraint Programming (CP) model
presented in this paper has the following major improvements: the new decision variables represent the
whole flight trajectory, which enables the removal of its potential conflicts happening at different flight
levels; introduces slight speed adjustments as decision variables in order to minimize the impact of the
CTOT shifting in the arrival time; the model can tackle the effect of along-track deviations, if they can be
measured or estimated; finally, the new CP formulation takes advantage from propagation mechanisms of
constraints such as no overlap, span and synchronize, with a very positive impact in the computational
effort required to solve this combinatorial optimization problem.
Moreover, the trajectory optimization studies focusing on the sensitivity of operational costs and efficiency
have been carried out in (Vilardaga et al., 2015) and a coordinated multi-aircraft 4D trajectories planning,
considering the buffer safety distance and fuel consumption optimization has been studied in (Qian et al.,
2017). Finally, machine learning techniques have been used recently, for example to address the short-term
trajectory prediction problem in Terminal Manoeuvring Area (TMA) based on 4D trajectory prediction as
in (Wang et al., 2017).

State of the Art
24
The introduction of the 4D TBO concept, furthermore allows introducing further system-level policy
decision making processes such as Short-Term ATFCM Measures (STAM). STAM can involve measures
like advancing or delaying aircraft by using the minor departure adjustments on the ground (referred to as
green delays in (Castelli et al., 2011; Piera et al., 2014)), fight level capping, minor re-routings e.g. in
(Adacher et al., 2017), linear holding e.g. in (Xu and Prats, 2017), slot allocation and sequencing methods,
e.g. in (Çinar et al., 2017; Liang et al., 2017; Marcella et al., 2017), headings or speed variations which
apply to a limited number of flights to reduce the complexity of the anticipated traffic peaks (Eurocontrol,
2017b). However, some manoeuvres are often not considered desirable measures by AUs due to high
operational and fuel consumption costs as it was evaluated in studies of (Ferguson et al., 2013; Envisa,
2017). Green delays on the ground are therefore a more acceptable alternative which is also the mitigation
measure used in this work. The concept considers the small departure time adjustments recognizing global
trajectory interdependencies. The goal of STAM applications is to support the dynamic Demand Capacity
Balancing (DCB) concept and therefore, to improve Air Traffic Flow and Capacity Management to enhance
the ATC workload as proposed in (Masalonis et al., 2003; Netjasov et al., 2011).
Historically, the ATFCM activities have been based on metrics estimated at strategic level such as the entry-
count, and more recently, the occupancy (Eurocontrol 2007). The number of aircraft that can be handled by
the ATCs is limited by their workload. When the maximum capacity is about to be reached, the air traffic
demand is limited by applying regulations to all the aircraft of the sector. Regulations produce delays or re-
routings and have a direct impact on the environment and in the airlines strategy. From the ATM point of
view, these measures are effective, because limiting the demand releases the system, but not efficient
enough because it affects all the agents of the system. The results of limiting the demand is an eventual
over-release of the airspace that reflects that the measures taken to avoid a likely high-demand situation
were not based on a good prediction of the system. The current metrics do not provide enough detail to
determine the effects of the expected demand in the ATCs workload. At this point, the DCB process requires
more realistic ways to determine how an increase of the demand in a sector affects the number of ATC
interventions, i.e. using machine learning and big data technologies to improve the forecasts or introducing
the use of complexity metrics in the regulation process.
Complexity metrics have been studied since many years by different authors (Netjasov et al. 2011).
Additionally, Air Navigation Service Providers (ANSP) could calculate their own complexity metrics to
reconfigure the airspace according to the required capacity or to support the decision-makers to impose
local restrictions, such as Minimum Departure Intervals (MDI) (Eurocontrol 2018). The effects of these
measures tend to be efficient in areas where many airports feed a high number of aircraft to a common
sector (e.g. London TMA). Although the MDI could be considered a more dynamic process, the principle
is based in limiting the demand of selected Standard Instrumental Departures (SID). Consequently, equally-
distributed ground delays (e.g. “one each ten minutes”) are applied to all the flights that use the affected
SIDs. To determine the required interval, the measure groups the affected flights by SID and its purpose is
limiting the entry-count/occupancy to the target sector like performed at strategic level during the DCB
process. The process does not identify what are the actual effects of selected flights in the target sector nor
in the ATC workload.
2.1. Constraint Programming Models in ATM
Nowadays, the systems strongly rely on Artificial Intelligence (AI) and Data Analysis (DA). During the
last years, supported by the introduction of the 4D-TBO concept, the application and improvement of
Decision Support Tools (DST) in ATM was advanced to support the global performance ambitions for air
traffic planning and optimization. From an operational research perspective, some ATM problems can be
seen as decision-making problems whose resolution consists of determining the domain values of the
decision variables to reach feasible solutions. Furthermore, in case an objective function is formulated to
describe the benefits of each feasible solution, there are some methods that could be applied to identify the
best solution. However, since ATM problems (such as re-routing, flight-level changes, or ground-holding
schemes) are usually complex problems of a large dimension, and highly combinatorial, there are few AI
problem-solving technologies that can cope with that many different degrees of freedom. One efficient
technique is CP, which has also been used in this work to determine which aircraft CTOT should be
modified within the domain of [-5,10] minutes. CP is a powerful paradigm for representing and solving a
wide range of combinatorial problems (Rossi, Van Beek et al., 2006) and offers a constrained version of

State of the Art
25
real world data analysis problems (Rossi et al., 2006). In the last years, the paradigm has attracted much
attention among researchers because it proposes on the one hand the modelling, using a high-level
programming language, and on the other hand the solving, using various techniques from different areas
such as mathematics, artificial intelligence, and operations research (Van Hentenryck et al., 1992).
Moreover, the nature of CP provides other important advantages such as a fast program development, an
economic program maintenance and an efficient runtime performance.
Other than metaheuristic or heuristic method, such as evolutionary algorithms, CP is used to solve complex
combinatorial Constraint Satisfaction Problems (CSP). CSPs are expressed in terms of three entities:
variables, their corresponding domains, and constraints relating them. Constraints can be considered as the
main characteristics of CP. They are treated as logical relations among several unknowns (or variables),
each taking a value from a set of accepted values called domain, which can be a range with lower and upper
bounds or a discrete list of numbers. Solving a CSP consists in assigning a value to each variable in such a
way that every constraint is satisfied. The main interest of such a technology is the generality in the notion
of what is a constraint. It enables the user to have access to a rich, high-level language that helps combine
constraints together to build new ones, thus leading to an expression of the problem that is very close to its
mathematical formalisation. The representation of the problem, in terms of constraints, results in short and
simple programs easily adaptable to future changing requirements (Bessiere, 2006).
The application of CP is used both in scientific and industrial sectors for many kinds of application, such
as scheduling or resource assignment problems. Furthermore, it has been successfully used in many
research studies in the ATM field, as reported in (Allignol et al., 2012). A CP model in the ATM context
that would consider all degrees of freedom (3D geometry and time) to generate an optimal set of conflict-
free 4D trajectories at a continental scale is out of scope reach for the current combinatorial problem-solving
technologies. In this work, the use of CP to reduce the ATC interventions by profiting of time stamps (i.e.
RBTs) as a degree of freedom is proposed. Furthermore, the degree of freedom is constrained to a time
window of -5 to +10 minutes of the assigned departure time and, in comparison to existing works, this
approach considers a fixed part which is determined by those aircraft that are already in the air and cannot
be modified. Therefore, the large-scale space of solutions is reduced to a size in which CP models could
provide feasible and even quasi-optimal solutions.
Considering the ATM sources of uncertainty (parameters of aircraft models in trajectory prediction,
weather, failure of ATC systems, cancellation of flights, etc.) and the degree of safety, a rolling horizon
model scope is recommended to be considered in CP models to handle reasonable amounts of uncertainty.
To avoid being affected by the scalability problems, the time windows should be considered small enough
to take into account only a limited amount of uncertainty. Based on the classification of uncertainty sources
as described in (Mondoloni, 2006; Casado et al., 2012) in which many uncertainties can be modelled as
stochastic variables, (Pabst et al., 2013) proposes a method to transfer those stochastic errors to the position
errors. In this work, a similar approach is presented, focusing on the weather forecast uncertainties,
particularly the impact of along-track wind uncertainty.
Existing literature shows that CP in ATM is used in rolling horizons in which the ‘past’ part of the current solution is fixed, and the decision variables are considered as constants. The ‘future’ part of the problem is resolved with the new horizon. Various CP models to improve air traffic services have been developed. For
example, a CP model for flight-level allocation for a vertical separation was developed in (Barnier et al.,
2004) and a CP model that minimizes the number of required ATFCM regulations has been developed in
(Kerlirzin et al., 2000). Models that focus on improving the ATC workload have been developed in
(Trandac et al., 2005) where a CP model for an airspace sectorization is presented and in (Flener et al.,
2007) a CP model to minimize and balance the traffic complexities of airspace of the adjacent sectors is
proposed. Finally, (Chemla et al., 1995) laid the foundation for CP modelling of the slot allocation
problems. In (Allignol et al., 2012) a better description of improvements to the slot allocation problems
together with CP applications can be found. Further planning methods and decision support tools can be
found in (Barnier et al., 2009) where a CP model for a conflict-free planning method is introduced and (Van
Leeuwen, et al., 2003) where a CP model for decision support is presented to aid the controllers in planning
the movements of flights within an airport and its airspace. The work presents a CP model to solve the
problem by describing the trajectory as a sequence of the time intervals that represent the conflict-free
segments and the concurrence events segments introducing a multi-flight level approach. The scheduling
State of the Art
26
consists in ensuring of the non-concurrent use of the areas that were in conflict. Since the tools highly rely
on an accuracy of the Trajectory Prediction (TP) to reduce the number of the en-route conflicts, the time
uncertainty is considered in the approach and to complement it different flight levels are considered. This
is supported by the calculation of more dynamic metrics based on short-term trajectory predictions that
identifies the effects of each AU as a stand-alone element of the system. This process determines the effects
of individual AUs in the number of ATC interventions by detecting the imminent and potential concurrence
events of each flight that crosses the target volume. Then, a small changes of the Estimated Take-Off Time
(ETOT) of selected flights in order to reduce the probability of ATC interventions is proposed.

Methodology
27
Chapter 3
3. Methodology
The main objective of the presented methodology is to enhance the airspace demand-capacity balance by
trying to reduce the potential air traffic controller interventions en-route. Towards this goal, tight
interdependencies between aircraft trajectories are identified at the network level and are removed by
rescheduling take-off times in such a way that target times of arrival are preserved within a one-minute
margin. This can be seen as a short term ATFCM measure that enables a slight increase in airspace capacity
by transferring the workload of controllers from conflict resolution and manoeuvre communication to
traffic monitoring.
The proposed concept is composed of three main functionalities: detection, analysis, mitigation. To this
aim, trajectories are mapped on a grid of cells and filtered to identify only the tightest concurrence events.
A trajectory interdependency exists when two or more aircraft share a similar set of spatiotemporal
coordinates. Subsequently, the trajectory interdependencies are classified and analysed using a causal
model that identifies a set of timestamp domains defined to highlight the weaknesses of the system. Lastly,
the most relevant interdependencies are mitigated by producing a delay or advance of their Estimated Time
of Take-Off (ETOT) for some selected flights linked to the tightest interdependencies.
3.1. Detection Methodology
The conflict detection is composed of two processes: the mapping process and the spatiotemporal
interdependency detection. The concurrence event detection methodology is designed to detect concurrence
events in different flight levels (FL). In comparison to existing concurrence event detection models, our
approach does not only identify pairwise conflicts but interdependencies between trajectories that lose their
safety buffer. The benefits of this methodology are the efficient way of identifying concurrence events in
air, the possibility to understand the impact of the trajectory interdependencies and to apply mitigation
measures.
In the following, the three processes for the 3D concurrence event detection are described.
3D Mapping Process
To detect concurrence events, the European airspace covering the longitude of -20 to 30 degrees and
latitudes of 0 to 80 degrees, is partitioned into square cells of 6 NM representing the lateral separation
minima en-route. The defined horizontal separation minimum based on radar and/or ADS-B and/or MLAT
system according to ICAO Doc 4444 (ICAO 2016) is set to 5 NM. In this work, the horizontal separation
is set to 6 NM to take into account any lateral deviations with respect to the RBT below 1 NM. It is worth
to mention that the cell size is a parameter that might be changed depending on the operational context (e.g.
in TMA the cell size can be set to 3NM). Taking advantage of the 4D-TBO concept that is based on the
integration of time into the 3D aircraft trajectory, 4D trajectories are project onto the grid. The benefit of
working with 4D trajectories is that this concept ensures that the aircraft can fly on a practically unrestricted,
optimum trajectory for as long as possible in exchange of the aircraft being obliged to meet very accurately
any arrival time over a designated point (SKYbrary 2017). As a result of the mapping projection a 4D
trajectory is partitioned in segments, one for each cell the trajectory occupies. All the generated segments
are stored in a matrix representing the grid, whose size depends on the cell size and vertical separation to
be considered. The segments are stored as a sequence of two or more 4D points containing latitude,
longitude, time and flight level. The first point in the sequence is the entry point in the cell and the last is
the exit point.

Methodology
28
To achieve a multi-level mapping an aircraft � that changes its flight level from flight level � to � + ,
will be represented on both flight levels during its climbing/descend manoeuvre. Applying this method, it
might occur that a concurrence event for aircraft � is registered in several fight levels because it is actually
performing a climbing or descend manoeuvre, so it might happen that several concurrence events involving
the same aircraft are detected simultaneously at the different flight levels. This is a rather conservative but
safe approach which is the most important factor in air traffic management. A graphical illustration of the
method used to detect concurrence events on a 3D level is represented in Figure 3.
Figure 3: 3D Multi-flight level mapping
Spatio-Temporal Interdependency detection
A concurrence event occurs when two or more aircraft loss the separation minima (vertical or horizontal).
The presented approach solves the existing concurrence events applying time shifts to some of the flights.
However, this aircraft take-off times shifts can generate additional concurrence events, which are called
potential concurrence events. Hence for the mitigation phase the potential concurrence events, that are the
critical spatio-temporal interdependencies between pairs of aircraft, must be detected.
The detection of spatio-temporal interdependencies is performed by calculating the temporal looseness
(“clearance time” or “overlap time”) between a pair of aircraft segments in the same cell (see Figure 4).
The temporal looseness of two aircraft can be calculated by determining the minimum value of the exit
time of the two aircraft minus the maximum entry time. To be considered as a potential concurrence event
the temporal looseness of a pair must satisfy:
Where �� is the maximum slot time shifting that can be applied (e.g. 10 min), and � the maximum
advanced time (e.g. -5 min), � an refers to the time of an aircraft � entering into the cell and
correspondingly, � refers to the time of the aircraft leaving the cell �. When there is a clearance,
and when > there is an overlap. For instance, if the domain for rescheduling the CTOT is set to [-5,
10] minutes, the greatest value of to consider a pair of aircraft as a potential concurrence event is 15
minutes (900 seconds). Therefore, the list of the tighter spatio-temporal interdependences must be filtered
with ℎ = 5 minutes, the maximum CTOT shifting window which would not endanger the safety
separation even if the shift at each interval end is applied to each aircraft.
A/C trajectory
Trajectory projection on
the upper level Trajectory projection on
the lower level
= (� , � ) − � (� , � ) −ℎ = �� − � (1)
Methodology
29
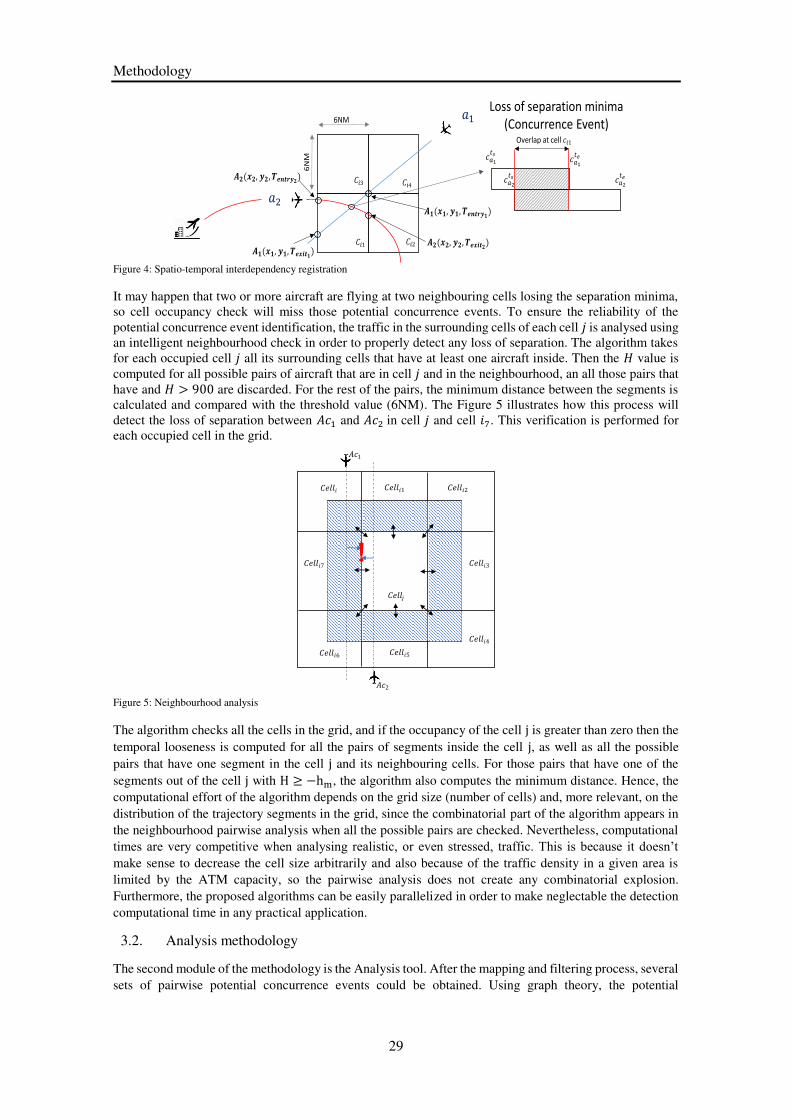
Figure 4: Spatio-temporal interdependency registration
It may happen that two or more aircraft are flying at two neighbouring cells losing the separation minima,
so cell occupancy check will miss those potential concurrence events. To ensure the reliability of the
potential concurrence event identification, the traffic in the surrounding cells of each cell is analysed using
an intelligent neighbourhood check in order to properly detect any loss of separation. The algorithm takes
for each occupied cell all its surrounding cells that have at least one aircraft inside. Then the value is
computed for all possible pairs of aircraft that are in cell and in the neighbourhood, an all those pairs that
have and > 9 are discarded. For the rest of the pairs, the minimum distance between the segments is
calculated and compared with the threshold value (6NM). The Figure 5 illustrates how this process will
detect the loss of separation between � and � in cell and cell 7. This verification is performed for
each occupied cell in the grid.
Figure 5: Neighbourhood analysis
The algorithm checks all the cells in the grid, and if the occupancy of the cell j is greater than zero then the
temporal looseness is computed for all the pairs of segments inside the cell j, as well as all the possible
pairs that have one segment in the cell j and its neighbouring cells. For those pairs that have one of the
segments out of the cell j with H −hm, the algorithm also computes the minimum distance. Hence, the
computational effort of the algorithm depends on the grid size (number of cells) and, more relevant, on the
distribution of the trajectory segments in the grid, since the combinatorial part of the algorithm appears in
the neighbourhood pairwise analysis when all the possible pairs are checked. Nevertheless, computational
times are very competitive when analysing realistic, or even stressed, traffic. This is because it doesn’t make sense to decrease the cell size arbitrarily and also because of the traffic density in a given area is
limited by the ATM capacity, so the pairwise analysis does not create any combinatorial explosion.
Furthermore, the proposed algorithms can be easily parallelized in order to make neglectable the detection
computational time in any practical application.
3.2. Analysis methodology
The second module of the methodology is the Analysis tool. After the mapping and filtering process, several
sets of pairwise potential concurrence events could be obtained. Using graph theory, the potential
6NM
6N
M
Overlap at cell
Loss of separation minima
(Concurrence Event)
�1
�2
1 2
3
4
5 6
7

Methodology
30
concurrence events detected in one cell at the same FL will form a node or vertex of a graph and its edges
will represent the interdependencies between potential conflicts.
After detecting the concurrence events, a set of trajectory interdependencies over the terminal airspace is
represented. The output represents all concurrence events as being interrelated. The objective is to
decompose the complex problem that is a conjunction of a huge amount of S-T interdependencies to reduce
the complexity, see Figure 6.
Figure 6: Illustration of interdependencies using graph representation
Then, the potential conflicts are grouped by cells and by flight level in order to identify clusters of potential
conflicts that share a physical location in the space. Once the clusters are made, it is distinguished the
pairwise conflicts that produces a unique potential concurrence event using time information. This step
transforms the spatial representation of the potential conflicts induced by the grid into a A-dimensional
representation, see Figure 7.
Figure 7: Regrouping two pairwise conflicts to form one conflict node
All the nodes in graph are outputs of this procedure, thus, one node, which represents one potential
conflict, could involve more than one aircraft. Furthermore, two different nodes may represent two potential
concurrence events in the same cell, but involving different aircraft in different time.
To construct it is defined also the edge set . As aforementioned, the edges in G must represent the
interdependencies between potential concurrence events and the rescheduled takes-off times. Hence, edges
must be related to RBTs of the aircraft involved in the nodes of . It is added and edge of uv to if and
only if there is at least one aircraft involved in node and in node . That is an edge ∈ if and only
if and shares an aircraft.

Methodology
31
Figure 8: Two potential conflicts sharing aircraft 1
Figure 8 shows two potential concurrence events that occur in different cells. Let be the node of G that
represents the potential conflict listed in cell � and the node for the conflict in � . Then, it is added the
edge uv to because and share Aircraft 1.
The problem is represented by taking advantage of the adjacency list and the adjacency matrix. For the
traversal graph, also known as graph search, the Depth-First Search (DFS) algorithm is used. By
formulating the problem using graph theory, the whole function can be decomposed to find a set of
disconnected graphs that form independent clusters, as shown in Figure 9.
Figure 9: Independent clusters
Moreover, graph representation allows identifying concurrence and coupling interdependencies.
Concurrence interdependencies are those which appear between aircraft that are in the same node in , see
Figure 10.
Figure 10: Concurrence interdependencies
If there exist in a -path between two nodes and each one encoding a potential conflict, then there
is a coupling interdependence between them, see Figure 11.
A1
A2 A4
C1C1 =

Methodology
32
Figure 11: Coupling Interdependencies
The introduction of coupling and concurrence interdependencies allows it to define metrics to understand
when an aircraft should be delegated or eliminated of the solution space.
Finally, when rescheduling take-off times, the potential concurrence event encoded in may result in a
reduction of the clearance in by modifying the CTOT of Aircraft 1 and vice-versa. In cases where
and represent potential conflicts with a positive clearance in both cases, a rescheduling take-off in
Aircraft 1 may remove one potential conflict but, produce at same time a real conflict later on. The
formulation based on graph theory allows to represent real conflicts and their interdependencies and to
visualize the complex structures.
Once the interdependent clusters are detected, the mitigation tool based on constraint programming can be
supported. By partitioning the problem size, better computational performance and the reduction of the
probability of ATC interventions due to greater clearance times could be achieved, which directly enhances
the airspace demand-capacity balance.
3.3. Mitigation Methodology
The mitigation algorithm shall be formulated as an optimization problem where the constraints are formulated
to remove the tight interdependencies (H>0). The mitigation tool is based on the following modelling
structures.
set of aircraft
set of cells that have a concurrence event
set of Flight Levels
�� = {< �, �, > | ∀� ∈ , ∀� ∈ , ∀ ∈ }
(2)
� � = { }, = . . �
(3)
d.v. � ∈ [−� , � ], ∀� ∈ (4)
d.v. � : � = � � + � − � + , ∀� ∈ �� (5)
d.v. = { � |� ∈ ��} , ∀� ∈ , ∀ ∈ (6)
d.v. = [ , (7)
d.v. = [s( ), ( ) , ∀� ∈ , ∀ ∈ , ∀ ∈ . . � : (8)
( ) ∈ [ ( ) − ( ), ( ) + ( )]
d.v. � = { | ∀� ∈ , ∀ ∈ , ∈ . . � } (9)
Minimize:
∑|� |= + ∑�= (10)
C1 C2 C3
C1, C2, C3 =
A1
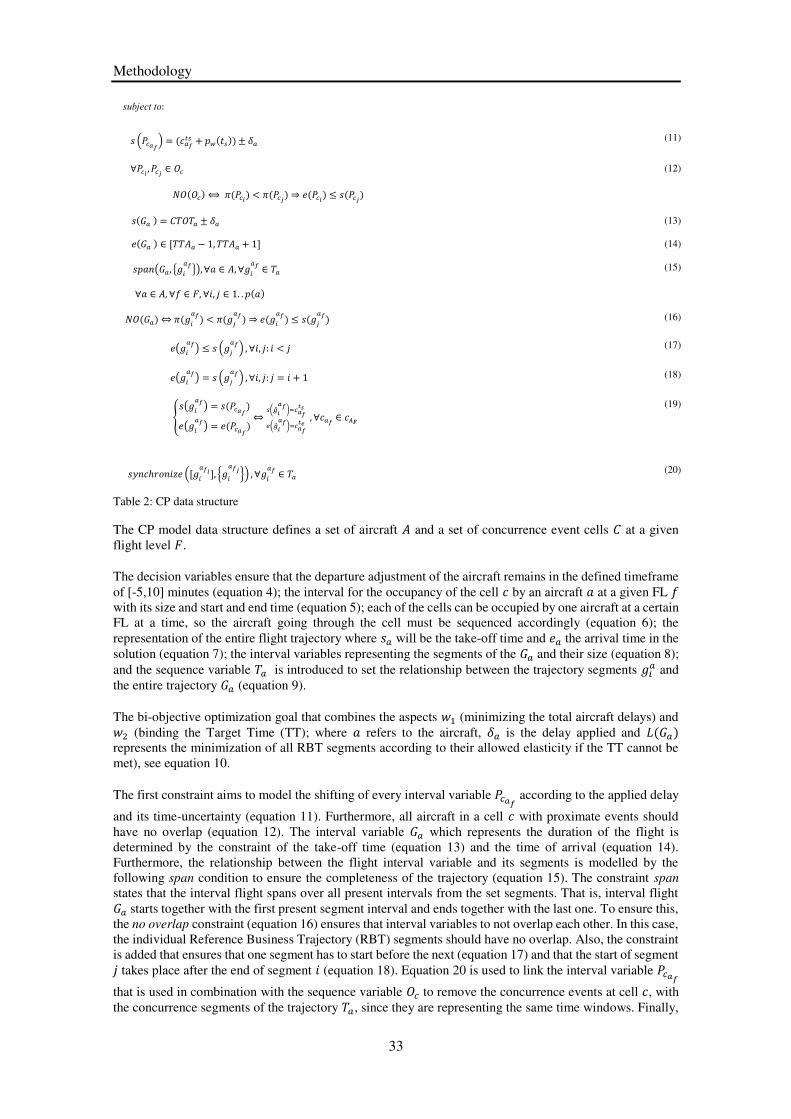
Methodology
33
subject to:
� = � + ± � (11)
∀ , ∈ (12)
⟺ < ⇒ = � � ± � (13) ∈ [�� − , �� + ] (14)
� ( , { }), ∀� ∈ , ∀ ∈ � (15)
∀� ∈ , ∀ ∈ , ∀ , ∈ . . �
⇔ < ⇒ (16)
( ) , ∀ , : < (17)
( ) = , ∀ , : = + (18)
{ ( ) = �( ) = � ⇔ (�� )= ��(�� )= � , ∀� ∈ ���
(19)
�ℎ [ ], { } , ∀ ∈ � (20)
Table 2: CP data structure
The CP model data structure defines a set of aircraft and a set of concurrence event cells at a given
flight level .
The decision variables ensure that the departure adjustment of the aircraft remains in the defined timeframe
of [-5,10] minutes (equation 4); the interval for the occupancy of the cell � by an aircraft � at a given FL
with its size and start and end time (equation 5); each of the cells can be occupied by one aircraft at a certain
FL at a time, so the aircraft going through the cell must be sequenced accordingly (equation 6); the
representation of the entire flight trajectory where will be the take-off time and the arrival time in the
solution (equation 7); the interval variables representing the segments of the and their size (equation 8);
and the sequence variable � is introduced to set the relationship between the trajectory segments and
the entire trajectory (equation 9).
The bi-objective optimization goal that combines the aspects (minimizing the total aircraft delays) and
(binding the Target Time (TT); where � refers to the aircraft, � is the delay applied and �
represents the minimization of all RBT segments according to their allowed elasticity if the TT cannot be
met), see equation 10.
The first constraint aims to model the shifting of every interval variable � according to the applied delay
and its time-uncertainty (equation 11). Furthermore, all aircraft in a cell � with proximate events should
have no overlap (equation 12). The interval variable which represents the duration of the flight is
determined by the constraint of the take-off time (equation 13) and the time of arrival (equation 14).
Furthermore, the relationship between the flight interval variable and its segments is modelled by the
following span condition to ensure the completeness of the trajectory (equation 15). The constraint span
states that the interval flight spans over all present intervals from the set segments. That is, interval flight starts together with the first present segment interval and ends together with the last one. To ensure this,
the no overlap constraint (equation 16) ensures that interval variables to not overlap each other. In this case,
the individual Reference Business Trajectory (RBT) segments should have no overlap. Also, the constraint
is added that ensures that one segment has to start before the next (equation 17) and that the start of segment
takes place after the end of segment (equation 18). Equation 20 is used to link the interval variable �
that is used in combination with the sequence variable to remove the concurrence events at cell �, with
the concurrence segments of the trajectory � , since they are representing the same time windows. Finally,

Methodology
34
(equation 20) synchronizes the trajectory segments of different FLs to model the 3D concurrence event
mitigation. (Schefers et al. 2016)
3.4. Relationship to papers
The described methodology has been presented in various journal and conference papers. The focus of the
paper
N. Schefers, J.J. Ramos: “A case of a modelled saturation level for cooperative flight departures”. Int. J. Simulation and Process Modelling, Vol. 13, No. 4, 2018, p. 310-323
has been to develop and apply the detection methodology and the mitigation model based on Constraint
Programming. In this paper it can be observed that the detection tool contains a sequence of processes to
detect concurrence events and that the Constraint Programming model focusses on the introduction of
segments to represent the entire RBT to reach the TTA by introducing speed adjustments. During this
research study, the methodology has been further improved and refined. In the paper:
N.Schefers, J.J. Ramos, P.Folch, J.L Muoz: “A Constraint Programming Model with Time Uncertainty for Cooperative Flight Departures”, Transportation Research C.
it can be observed that the detection process has been improved to be more efficient. The paper represents
the latest progress of this research. In fact, a powerful detection tool has been designed that is able to detect
concurrence events in a 2h traffic sample within seconds. Furthermore, the dimensions have been extended
towards considering Multi-Flight-Levels. The CP model also has been extended supporting speed
adjustments, Multi-Flight-Levels and time uncertainty. The time uncertainty approach also has been
improved during this research. First findings are documented in the paper:
J.J. Ramos, N. Schefers, M. Radanovic, M.A Piera, P. Folch: “A Constraint Programming Model with Time Uncertainty for Cooperative Flight Departures”, 12th USA/Europe Air Traffic Management R&D Seminar, Seattle, June 2017.
The analysis methodology was published in a complementary conference paper “A decision support tool
for strategic conflict management through assignment of calculated take-off times” that was presented at
the International Conference on Harbour, Maritime & Multimodal Logistics M&S – HMS, 2017 and also,
a description of this methodology can be found in the paper “STAM-based methodology to prevent
concurrence events in a Multi-Airport System (MAS)”, Transportation Research C (under review).

Application and experimental results
35
Chapter 4
4. Application and experimental results
A STAM-based methodology to reduce the number of ATC interventions on air has been developed during
this research study. The three-step methodology, composed by detection, analysis and mitigation, was used
to develop a framework designed to be executed as a recurrent TBO service. The spatio-temporal
interdependency analysis method provides a baseline to design new metrics that could support the
application of alternative pre-tactical measures to the current MDI.
The three different models have been with quite promising results. The methodology of the detection tool
has been improved including an efficient 3D mapping process, a spatio-temporal interdependency detection
and an intelligent neighbourhood search. The development of the tool can be seen during the research
process. The tool has been validated within the scope of the AGENT and PARTAKE project and can
process one day of traffic in less than 50 min. in a standard desktop computer. Furthermore, the detection
of 2h of traffic takes only a few minutes.
The analysis tool is an innovative approach to identify topologies among interdependencies detected with
the detection module and that cannot be removed by the CTOT (constrained) shifting. Furthermore, this
process is useful to name the trajectories that should be removed at the mitigation phase in order to provide
a more robust departure coordination solution. The analysis tool translates pairwise potential concurrent
events described by using 4 dimensional coordinates into a planar representation allowing its visualization.
This simplification is a useful tool to graphically analyses the whole system, since the information encoded
in the mapping output list is presented as an interdependence graph. Finally, induced metrics such as the
concurrence and coupling level can be extracted from the intrinsic information encoded in the graph
representation and used later by the mitigation tool. The concurrence interdependencies will be a function
of the number of aircraft occupying a particular cell, in other words, this level will be the size of the potential
conflict encoded by the node. The coupling level of one aircraft, which will be used as a weight in the
objective function of the constraint programming model for the resolution phase, will be a function of the
degree of the nodes where it passes and its path length.
The mitigation tool has been one of the main working areas during this research. A Constraint Programming
model was developed for solving the concurrence events that might occur when the departure traffic is
inserted into the en-route traffic. The model has been evolved during the research leading from a single
CTOT shift to a version that represents the whole trajectory using the concept of segments. As an initial
step, the simple model has been tested over a realistic scenario showing the occupation of the cells before
and after the mitigation process. Then, an experiment was carried out in which the method of reification
was added to the model to identify saturation levels.
During the research period the mitigation model has been further extended. Now, the Constraint
Programming model is considering different flight levels, slight speed adjustments and time uncertainty.
Finally, the methodology has been tested as a unit. In order to reduce the look-ahead time, the tool was
tested in a Terminal Manoeuvring Area (TMA). In particular, the London Terminal Manoeuvring area. The
results of various fast simulations of a realistic scenario are summarized in an article that has been submitted
to the Journal Transportation Research Part C.
4.1. Relationship to papers
The proposed methodology has been tested using different realistic and traffic scenarios and fast
simulations. The paper

Application and experimental results
36
N. Schefers, J.J. Ramos: “A case of a modelled saturation level for cooperative flight departures”. Int. J. Simulation and Process Modelling, Vol. 13, No. 4, 2018, p. 310-323.
Shows the application of the model to an over-stressed realistic scenario. The scenario was composed of a
set of 4010 real 4D trajectories in the European airspace for a time window of 2 h. In this work, TBO
without uncertainties was assumed. The main focus of this paper was to prove the right way of working of
the tool. Taking an extract of the paper it can be seen in Figure 12 and Figure 13 the traffic through the cells
with potential concurrence events and the conflict free solution.
Figure 12: Gantt diagrams showing the traffic through the cells with potential concurrence events, the dagram shows
the emerging conflict after inserting the departing traffic for the same time period.
Figure 13: The diagram shows the conflict free solution after applying small adjustments on CTOT and segment’ speed.
Furthermore, in the articles:
J.J. Ramos, N. Schefers, M. Radanovic, M.A Piera, P. Folch: “A Constraint Programming Model with Time
Uncertainty for Cooperative Flight Departures”, 12th USA/Europe Air Traffic Management R&D Seminar, Seattle, June 2017.
N.Schefers, J.J. Ramos, P.Folch, J.L Muoz: “A Constraint Programming Model with Time Uncertainty for Cooperative Flight Departures”, Transportation Research C.
In the latter, the model was applied to a 1h traffic scenario covering the BeNeLux airspace to show the
effect of the tool under time uncertainty. Under the assumptions expressed in the paper, the effects on the time
diversion on the conflict window can be seen in Figure 14. For this experiment, a headwind of 50 knots or 92.6 km/h
at FL 360 was assumed (ATSC113 2017). The total time needed to recover the time diversion in this case is 10.6
minutes (636 seconds).

Application and experimental results
37
Figure 14: Effects of time diversion on conflict window of the experiment
Finally, the proposed methodology has been adjusted to the environment of a Terminal Maneuvring Aera.
The results are documented in the paper
N. Schefers, M.A. Amaro, J.J. Ramos, F. Saez: “STAM-based methodology to prevent concurrence events
in a Multi-Airport System (MAS)”, Transportation Research C (under review).
As an initial step, a traffic scenario was selected to perform the fast simulation and to provide
recommendations about the most relevant operating parameters: cell size, number of operating airports and
look-ahead time. It was used a sample traffic data of 19th of July 2017 from 6am to 7am. LTMA has been
the target of an important number of regulations during summer of 2017 (including the 19th of July 2017),
and most regulations occurred in the traffic peak period between 6:00am and 7:00am (Eurocontrol 2017).
The number of concurrence events that were detected can be seen in Figure 15.
Figure 15: Total detected CE and PCEs according to the applied cell size
Further experiences have been perfromed using different traffic scenarios to evaluate the optimal working
parameter for the tool in terms of : cell size, number of operating airports and look-ahead time.
-5
0
5
10
15
20
25
30
35
-200 0 200 400 600 800 1000 1200
Tim
e d
ive
rsio
n ( )
Absolute time in sec.
Effects of time diversion on conflict window
Evolution of ρ(t) when FMS is
correcting ρ(t)
Evolution of ρ(t) until the FMS
guidance functionality is
activated again
17 24 45 78 8687
195
284
466
610
2 3 4 5 6
PC
E/C
E
CELL SIZE
TOTAL DETECTED CE VS . CE THAT BELONG TO THE
ALGORITHMS S OLUTION S PACE (PCE)
CE that belong to the algorithms solution space (PCE) All detected CEs

Application and experimental results
38
Paper 1
39
Chapter 5
5. Paper 1
In addition to the literature review given above, the first paper “Causal analysis of airline trajectory preferences to improve airspace capacity” that has been published in Procedia Computer Science 104, p.
321-328, narrows the topic within the ATM framework by illustrating ATM concepts such as ATM
planning layers, the TBO concept and the 4-D trajectory management. The paper analyses the existing
system, the description of a new vision for the short term demand capacity balancing, and establishes the
basic elements for the operational environment.
Procedia Computer Science 104 ( 2017 ) 321 – 328
Available online at www.sciencedirect.com
1877-0509 © 2017 The Authors. Published by Elsevier B.V. This is an open access article under the CC BY-NC-ND license (http://creativecommons.org/licenses/by-nc-nd/4.0/).
Peer-review under responsibility of organizing committee of the scientific committee of the international conference; ICTE 2016
doi: 10.1016/j.procs.2017.01.141
ScienceDirect
ICTE 2016, December 2016, Riga, Latvia
Causal Analysis of Airline Trajectory Preferences to Improve
Airspace Capacity
Nina Schefersa,* , Miquel Angel Piera
a, Juan José Ramos
a , Jenaro Nosedal
b
aUniversitat Autònoma de Barcelona, C/ Emprius 2, 08202 Sabadell, Spain bYork University, 4700 Keele St, Toronto, ON M3J 1P3, Canada
Abstract
The problem of fitting the maximum number of aircraft into ATC sectors, keeping in mind aircraft separation and safety
standards, area navigation direct routings and other factors, is known as the airspace capacity problem. Above the European
airspace, a high density network of air traffic can be found which is determined by the workload of controllers. Constraint
Programming (CP) is a powerful powerful paradigm for representing and solving a wide range of combinatorial problems. The
PARTAKE project fosters adherence of air space user’s trajectory preferences enhancing Trajectory Based Operations (TBO)
concepts by identifying tight interdependencies between trajectories and introducing a new mechanism to improve aircraft
separation at the hot spots by the mean of CP. The underlying philosophy is to capitalize present freedom degrees between
layered ATM planning tools, when sequencing departures at airports by considering the benefits of small time stamp changes in
the assigned slot departures.
© 2016 The Authors. Published by Elsevier B.V.
Peer-review under responsibility of organizing committee of the scientific committee of the international conference; ICTE 2016.
Keywords: Air traffic management; Trajectory Based Operations; Decision Support Tool; Airspace capacity
1. Introduction
As widely known, air transport industry plays a major role in world economic activity and remains one of the
fastest growing sectors of the world economy. Because of the continued growth in civil aviation, in many places,
* Corresponding author. Tel.: +34 633456617.
E-mail address: [email protected]
© 2017 The Authors. Published by Elsevier B.V. This is an open access article under the CC BY-NC-ND license (http://creativecommons.org/licenses/by-nc-nd/4.0/).Peer-review under responsibility of organizing committee of the scientific committee of the international conference; ICTE 2016

322 Nina Schefers et al. / Procedia Computer Science 104 ( 2017 ) 321 – 328
demand often exceeds the available capacity of the air transport system to accommodate air traffic, resulting in
significant downstream effects1.
The processes used in the International Civil Aviation Organization (ICAO), such as the Flight Plan, have proved
their efficiency, however it is well accepted that there are several shortcomings regarding their performance.
According to the ICAO (Doc. 9854), it was already recognized in the 1980s that the existing approach to the
provision of Air Traffic Services (ATS) and the air navigation system was limiting continued aviation growth and
constraining improvements in safety, efficiency and regularity. However, it became clear that the changes needed to
improve the operational concept cannot be achieved by revolution but have to undergo an evolutionary process.
The ICAO ATM operational concepts are applied in several integrated service areas. To better understand the
complex interrelationships a short description is summarized. In this research, the ATM System is understood as a
holistic entity consisting of seven ATM conceptual components1:
Airspace organization and management
Demand/capacity balancing
Aerodrome operations
Traffic synchronization
Conflict management
Airspace user operations
ATM service delivery management
In order to have a well-functioning ATM system, all these components have to be present and properly
integrated. In addition to the seven concept components, the exchange and management of information used by the
different processes and services is of great importance.
Furthermore, the airspace organization and management provides the strategies, rules and procedures by which
the airspace will be structured to accommodate the different types of air activity, volume of traffic, and different
levels of service and rules of conduct. These management activities are underlined by the demand and capacity
balancing that can be divided into strategic-, pre-tactical-, and tactical stages1.
In Europe, an Air Traffic Flow Management (ATFM) service has been established to use the given capacity to
the maximum extent possible keeping in mind the guiding principles safety, continuity and expeditious for the flow
of air traffic. On strategic level, demand and capacity balancing will respond to the fluctuations in schedules and
demands using the Integrated Initial Flight Plan Service (IFPS) where Airspace Operators (AO) and Air Traffic
Service Units (ATSU) can specify their most economic and efficient flight plan or repetitive flight plan. All
activities are based on principles of the Air Traffic Flow and Capacity Management (ATFCM) and regional
European supplementary procedures described in the ICAO document 7030. Information can be retrieved from the
System Wide Information Management (SWIM) platform, an advanced technology program designed to facilitate
greater sharing of ATM system information, such as airport operational status, weather information, flight data,
status of special use airspace, and National Airspace System (NAS) restrictions. At this stage, planning activities are
fulfilled with a timeframe of seven or more days before the operation day.
At pre-tactical and tactical stage demand and capacity balancing evaluates the current allocation of the ATM
service provider, airspace user and aerodrome operator assets and resources against the projected demands applied
approximately 6 days to 1 day before the operation day. Approaching the operation day, demand and capacity
balancing focuses more detailed on demand management to adjust imbalances where activities take place between 5
days and 3 hours prior to departure. The system involved at this stage is the Enhanced Tactical Flow Management
System (ETFMS) that receives metadata from the IFPS by Air Traffic Service (ATS) Data Exchange Presentation
format and based on this input tracks the aircraft with accurate near-to-real-time data, recalculating 4D profiles of
flights allowing traffic demand to be understood more precisely. Integrated in the ETFMS is the Computer Assisted
Slot Allocation (CASA) system that operates under the “First-Planned, First-Serve” policy. The CASA system
calculates the Estimated Time Over for each point of entry in each sector and allocates the Estimated Off-Block
Time (EOBT) plus the taxi-time at the departure aerodrome and finally provides the Calculated-Take-Off-Time
(CTOT) that must be followed within a -5 to +10 minutes’ slot window2.
323 Nina Schefers et al. / Procedia Computer Science 104 ( 2017 ) 321 – 328
At operational level, the strategic ATFCM concept is taken over by the Air Navigation Service Provider (ANSP)
using Air Traffic Control (ATC) systems as for instance the Flight Data Processing System (FDPS) that is based on
a trajectory-based model and which is interconnected with external sources (e.g. Network Manager) to exchange
data.
Attempting to improve the slot situation, new information processes and systems are under development to meet
the current European capacity demands. The goal hereby is to improve the flight planning process and the
supporting systems to create shorter routes, reduce emissions, reduce delays and improve the connectivity of
trajectories. As a result, the ATFCM adherence measured at its effect and safety level can be revealed and the
overload of ATC workload in dense sectors could be decreased.
The paper is organized as follows: Section 2 explains the PARTAKE Project, section 3 describes the tight
trajectory detection, and section 4 outlines the tight trajectory resolution. Solutions obtained and an outlook for
future research will be given in section 5 and 6.
2. The PARTAKE project
The approach presented in this paper follows the research project PARTAKE3. It is a Research Exploratory
H2020 project that aims to help mature new concepts for ATM emerging technologies and methods proposing new
approaches to improve airspace capacity. The seeks to improve the present demand/capacity balance in ATM by
introducing small ground delays in the programmed departure that will not affect the planned traffic since the slot
time window assigned to each aircraft will be preserved. The mayor challenge PARTAKE is facing is to reach a
robust combination of Reference Business Trajectory (RBT) time stamps.
The vision of the PARTAKE project is to enable a flexible synchronization mechanism that will support an
efficient and competitive use of the ATM services based on an intelligent cooperative combination of the time stamp
component of the RBT agreed by the Airspace Users (AU’s). The core research activities in PARTAKE are geared
toward the next 4 concepts:
2.1. Tight trajectory interdependencies: Mitigating adherence problems
In PARTAKE4, 4-dimensional trajectories (4DT) are considered as a precise description of an aircraft path in
space and time which include the ”centerline” of the path, using Waypoints (WPs) to represent specific steps along
the path, together with appropriate buffers to describe the associated position uncertainty. The path contains altitude
descriptions for each WPs and suitable indications about the time(s) at which the trajectory will be executed. Some
of the WPs in a 4DT path may be associated with Controlled Time of Arrivals (CTAs). Each CTA is defined by a
Target Time of Arrivals (TTAs) requirement that must be met by the aircraft within a specified time tolerance.
Therefore, CTAs actually represent time “windows” for the aircraft to cross specific waypoints and will be used to
improve the clearance between aircraft at identified concurrence events.
2.2. Gap Analysis of time stamp combinations to improve time clearances
A causal model is used to analyse the RBT’s interdependencies quantified by the temporal looseness. Tight
interdependencies (i.e. loose of separation minima) can be relaxed by a small adjustment of the CTOTs of the
involved aircraft preserving the TTA and the slot assigned at strategic level. In this way, the "first planned, first
served" policy used by most airports could be improved since this policy is justified only due to a lack of tools and
relevant information that could analyse the downstream impact of different sequencing departures on saturated
sectors.
2.3. Improving adherence robustness through relaxing some non-relevant time stamp contracts
Tight interdependencies enhances the propagation of perturbations, thus, the effects of a poor time waypoint
adherence in a high density sector can generate a huge amount of changes in the rest of the trajectories, whereas
poor time waypoint adherence in those sectors without tight interdependencies do not create side effects. There are

324 Nina Schefers et al. / Procedia Computer Science 104 ( 2017 ) 321 – 328
few sectors in Europe with tight interdependencies, which allow adjusting waypoint time-stamps in those areas with
a low occupancy factor and negligible soft interdependencies. Thus to preserve time stamp agreements at tight
waypoints, it is possible to relax time stamps in some areas to compensate the effect of potential uncertainties
(departure time uncertainty and cruise speed uncertainty) or to extend the functionality provided by calculating the
CTOT.
2.4. Dynamic, multi-objective optimization model to support AU’s business targets
ATM metrics such as Traffic Density, Peak Load, Occupancy and Number of Conflicts will be evaluated in each
sector based on the AU’s trajectories and the PARTAKE trajectories to synthesize performance comparative
indicators at micro level, so the different stakeholders will be able to check the benefits of the developed tools.
In PARTAKE, pre-flight RBT’s (at departure) and en-route RBT’s (network scope) are mapped into micro-
regions pre-flight (trajectory scope) to identify interdependencies and compute feasible clearances to relax tight
interdependencies while preserving ATFM TTA and departure slot time constraints. The model to identify the tight
trajectory interdependencies will be specified in Coloured Petri Net formalism for an efficient causal analysis while
the time stamp control will be evaluated in Constrain Programming (CP). A Service-Based Architecture (SOA) will
be used to implement the interface with SWIM while agent-based technologies will be deployed to evaluate in a
simulation environment the acceptability of the solutions by the AU’s.
3. Tight trajectory interdependencies detection
PARTAKE methodology considers three steps to detect tight concurrence events before the take-off times are
slightly adjusted by CP. The first process is the Macro-mapping process, followed by the second process the Micro-
mapping process. The third process is based on a Filtering process. Once the tight concurrence events have been
detected, slight adjustments on the takeoff time based on CP solutions are applied.
The macro and micro detection process are based on the traffic mapping onto a grid of square macro-cells (12
NM). The grid spans over European Civil Aviation Conference (ECAC) airspace in its totality. The input trajectories
(RBT) must be discretized in time-equidistant samples. Each sample contains the horizontal position, indicated by
geographical coordinates, and altitude. The position in the sequence of discrete points represent the relative time
instant with respect to the known CTOT. The time stamp of each trajectory point can therefore be calculated from
the sequence according to the sampling period.
All trajectories are loaded and mapped onto the grids of square macro-cells. Entry and exit times are registered in
order to get the cell occupancy time window. Detection at macro-cell level is implemented by determining those
macro-cells where more than one aircraft has been detected, indicating the presence of regions that may contain
concurrence events. Next step is micro mapping: each macro-cell with potential concurrence events is divided into
four microcells, with quadrants named I, II, III and IV. The partition procedure is shown in Fig. 1a, where refers
to quadrant I of cell etc.
To determine whether a trajectory occupies one of the four microcells (squares of 6 NM), the trajectory points
within the macro-cell are analysed and the occupancy time window is registered. Detection at micro-
cell level is implemented by determining those micro-cells where more than one aircraft has been detected. The
detection process cannot be limited to one (macro or micro) cell occupancy analysis. The potential concurrence
events with trajectories at the surrounding cell must be also investigated. Fig. 1b illustrates this shifting analysis. All
the potential conflicts are registered providing position information about the quadrant and the cell of the
overlapping of two or more aircraft and the aircraft involved in the overlap. This set of potential concurrence events
is the input for the next filtering module.
The filtering process to be implemented in this module shall filter those trajectories either losing the required
clearance (separation minima) or in a risk of losing it after mitigation measures are applied. The filtering process is
based on the collective micro-regions detected in the mapping tool. For these collective micro-regions, entry and
exit times are used to determine the temporal looseness, referring to the size of the overlap or clearance between
aircraft pairs.

325 Nina Schefers et al. / Procedia Computer Science 104 ( 2017 ) 321 – 328
Fig. 1. (a) Micro and macro mapping processes; (b) Neighbourhood detection.
The calculation of the temporal looseness between time windows of aircrafts and in a collective micro-
region is expressed as follows:
max
Concurrence events exist when is positive, indicating an overlap, whereas events with a negative value have
a clearance time, indicating a potential concurrence event. Based on the calculation of (the size of an overlap or
clearance), it is possible to identify the ‘‘tightest’’ concurrence events, or potentially concurrence events, for each
pair of aircraft. Hence, to shorten the overall list, all redundant or highly slack events between pairs of aircraft are
eliminated, whereas the most critical or closed interactions are retained. Because departure slot allocation times
must be respected, the maximum value for a time adjustment on CTOTs will be considered to be between -
and . Therefore, potential concurrence events with a clearance time longer than have sufficient time
separation to be neglected, even when the maximum adjustment time is applied. A safety buffer can be added to
the in order to ensure a clearance time between any pair of aircrafts going into a collective micro-region.
a b
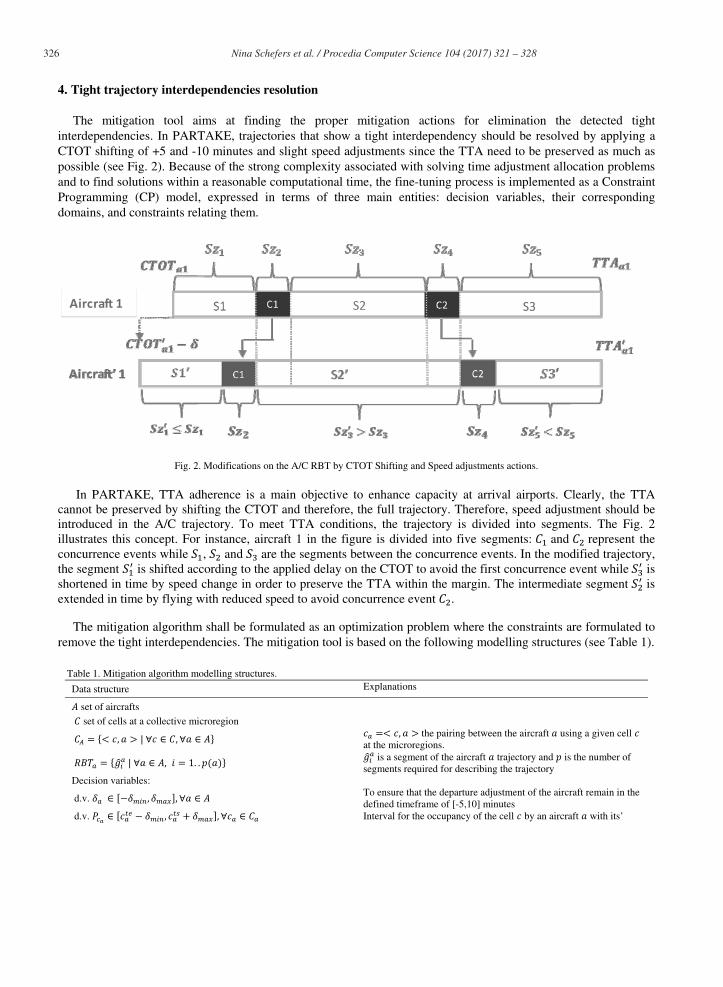
326 Nina Schefers et al. / Procedia Computer Science 104 ( 2017 ) 321 – 328
4. Tight trajectory interdependencies resolution
The mitigation tool aims at finding the proper mitigation actions for elimination the detected tight
interdependencies. In PARTAKE, trajectories that show a tight interdependency should be resolved by applying a
CTOT shifting of +5 and -10 minutes and slight speed adjustments since the TTA need to be preserved as much as
possible (see Fig. 2). Because of the strong complexity associated with solving time adjustment allocation problems
and to find solutions within a reasonable computational time, the fine-tuning process is implemented as a Constraint
Programming (CP) model, expressed in terms of three main entities: decision variables, their corresponding
domains, and constraints relating them.
Fig. 2. Modifications on the A/C RBT by CTOT Shifting and Speed adjustments actions.
In PARTAKE, TTA adherence is a main objective to enhance capacity at arrival airports. Clearly, the TTA
cannot be preserved by shifting the CTOT and therefore, the full trajectory. Therefore, speed adjustment should be
introduced in the A/C trajectory. To meet TTA conditions, the trajectory is divided into segments. The Fig. 2
illustrates this concept. For instance, aircraft 1 in the figure is divided into five segments: and represent the
concurrence events while , and are the segments between the concurrence events. In the modified trajectory,
the segment is shifted according to the applied delay on the CTOT to avoid the first concurrence event while is
shortened in time by speed change in order to preserve the TTA within the margin. The intermediate segment is
extended in time by flying with reduced speed to avoid concurrence event .
The mitigation algorithm shall be formulated as an optimization problem where the constraints are formulated to
remove the tight interdependencies. The mitigation tool is based on the following modelling structures (see Table 1).
Table 1. Mitigation algorithm modelling structures.
Data structure Explanations
set of aircrafts
set of cells at a collective microregion
the pairing between the aircraft using a given cell
at the microregions.
is a segment of the aircraft trajectory and is the number of
segments required for describing the trajectory
Decision variables:
d.v. To ensure that the departure adjustment of the aircraft remain in the
defined timeframe of [-5,10] minutes
d.v. Interval for the occupancy of the cell by an aircraft with its’
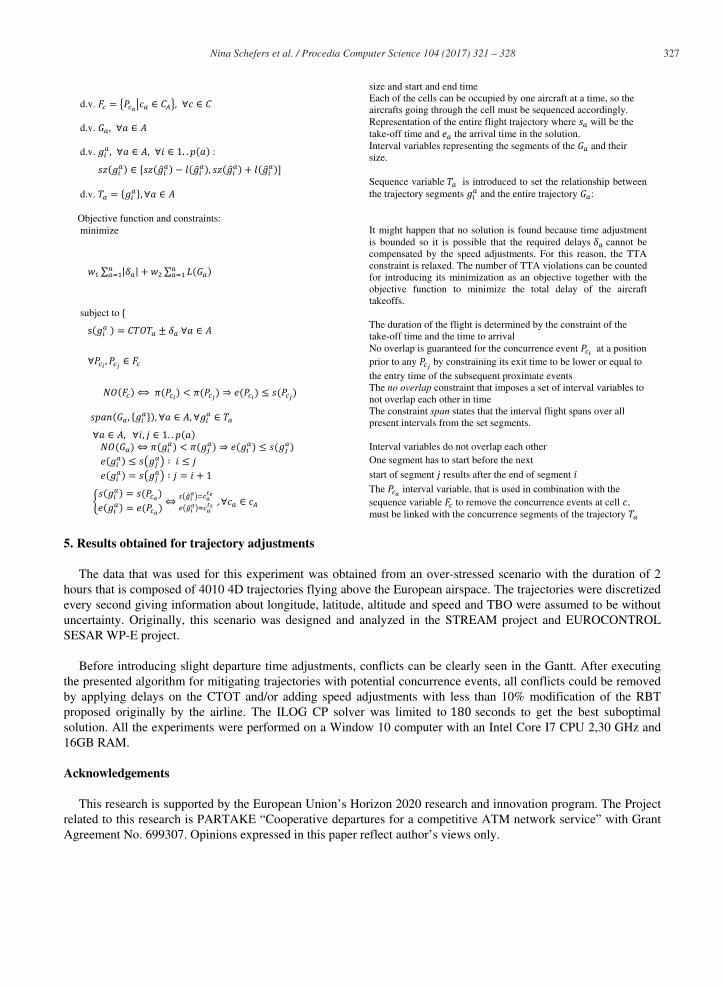
327 Nina Schefers et al. / Procedia Computer Science 104 ( 2017 ) 321 – 328
size and start and end time
d.v. Each of the cells can be occupied by one aircraft at a time, so the
aircrafts going through the cell must be sequenced accordingly.
d.v. Representation of the entire flight trajectory where will be the
take-off time and the arrival time in the solution.
d.v. :Interval variables representing the segments of the and their
size.
d.v.
Sequence variable is introduced to set the relationship between
the trajectory segments and the entire trajectory :
Objective function and constraints:
minimize It might happen that no solution is found because time adjustment
is bounded so it is possible that the required delays cannot be
compensated by the speed adjustments. For this reason, the TTA
constraint is relaxed. The number of TTA violations can be counted
for introducing its minimization as an objective together with the
objective function to minimize the total delay of the aircraft
takeoffs.
subject to
The duration of the flight is determined by the constraint of the
take-off time and the time to arrival
No overlap is guaranteed for the concurrence event at a position
prior to any by constraining its exit time to be lower or equal to
the entry time of the subsequent proximate events
The no overlap constraint that imposes a set of interval variables to
not overlap each other in time
The constraint span states that the interval flight spans over all
present intervals from the set segments.
Interval variables do not overlap each other
One segment has to start before the next
start of segment results after the end of segment
The interval variable, that is used in combination with the
sequence variable to remove the concurrence events at cell ,
must be linked with the concurrence segments of the trajectory
5. Results obtained for trajectory adjustments
The data that was used for this experiment was obtained from an over-stressed scenario with the duration of 2
hours that is composed of 4010 4D trajectories flying above the European airspace. The trajectories were discretized
every second giving information about longitude, latitude, altitude and speed and TBO were assumed to be without
uncertainty. Originally, this scenario was designed and analyzed in the STREAM project and EUROCONTROL
SESAR WP-E project.
Before introducing slight departure time adjustments, conflicts can be clearly seen in the Gantt. After executing
the presented algorithm for mitigating trajectories with potential concurrence events, all conflicts could be removed
by applying delays on the CTOT and/or adding speed adjustments with less than 10% modification of the RBT
proposed originally by the airline. The ILOG CP solver was limited to seconds to get the best suboptimal
solution. All the experiments were performed on a Window 10 computer with an Intel Core I7 CPU 2,30 GHz and
16GB RAM.
Acknowledgements
This research is supported by the European Union’s Horizon 2020 research and innovation program. The Project
related to this research is PARTAKE “Cooperative departures for a competitive ATM network service” with Grant
Agreement No. 699307. Opinions expressed in this paper reflect author’s views only.

328 Nina Schefers et al. / Procedia Computer Science 104 ( 2017 ) 321 – 328
References
1. ICAO. Global Air Traffic Management Operational Concept. Doc. 9854. AN/458. First Edition; 2005.
2. Cook A. European Air Traffic Management – Principles, Practice and Research; 2007.
3. PARTAKE. Project Proposal; 2015.
4. PARTAKE. Deliverable 1.1 - Report on PARTAKE functional and non-functional requirements; 2016.
Nina Schefers received her bachelor degree in International Information management from
the Universität Hildesheim, Germany in 2013 and her master degree in Logistics and Supply
Chain Management from the Universitat Autonoma de Barcelona (UAB), Spain in 2015.
Currently, she is a Ph.D candidate at UAB with research work related to aeronautics and
logistics. Her research line is related to decision making and optimization of processes in
Logistics, Manufacturing and Transportation.
Juan J. Ramos is a researcher focusing on modelling, simulation and optimization of
dynamic systems, especially in the field of logistics. He received his Ph.D. from the
Universitat Autonoma de Barcelona (UAB), Spain in 2003, where he is professor at the Dep.
of Telecommunication and System Engineering. He is currently the program Director of the
European Master on Logistics and Supply Chain Management at UAB. He is a member of
LogiSim, a recognized research group on Modeling and Simulation of Complex Systems.
Furthermore, he is expert in production technologies/logistics, intelligent transport systems,
information and communication technology, industrial collaboration and technology transfer.
Jenaro Nosedal-Sánchez received his bachelor and master degree in Industrial Engineering
from National Autonomous University of Mexico (UNAM) and Ph.D. from Universitat
Autonoma de Barcelona, Spain. As Deputy Director of High Impact Projects at Mexico’s
National Council of Science and Technology was responsible of funding management for
R&D project related to Aeronautics and Airport Management. Currently, he is postdoctoral
fellow at York University, Canada. His research line is modeling and simulation for process
improvement in Management, Logistics, Manufacturing and Transport Systems.
Miquel Angel Piera Eroles is associate Professor in the System Engineering Department at
Universitat Autònoma de Barcelona. Miquel graduated with excellence from UAB in
Computer Engineering (1988), Msc from University of Manchester Institute of Science and
Technology in Control Engineering (1991), and PhD from UAB in 1993. Dr. Piera is former
deputy director of the UAB Engineering School and director of LogiSim (research group on
Modelling and Simulation of Complex Systems). Dr. Piera has received several awards and
recognitions, among which it is mentioned the “Outstanding Professional Contribution Award“
from the internal Society for Computer Simulation (SCS) in USA in 2013. He has coordinated
as Scientific Coordinator more than 10 Spanish research projects and more than 20 Industrial
funded projects, he has also participated in a number of EC funded research and academic. He
is author of more than 100 scientific papers, 9 scientific books and has been invited as Key
note speaker in more than 10 international conferences.

Paper 1
48

Paper 2
49
Chapter 6
6. Paper 2
The paper “A case of a modelled saturation level for cooperative flight departures” that has been published in the International Journal of Simulation and Process Modelling, Vol. 13, No. 4, 2018, p. 310-323 shows
the methodology of the detection tool and a detailed description of the development of the mitigation tool
using Constraint Programming formalism. In this work, a CP model is presented for solving the concurrence
events that might occur when the departure traffic is inserted into the en-route traffic. It can be seen that
the complexity of the proposed model increases from a simple shift of the trajectory towards introducing
the concept of segments which make it possible to describe the whole trajectory from departure until the
arrival time to the destination. Finally, in this paper, the concept of reification was introduced to the model
to detect potential saturation levels of conflict scenarios. Compared to other models, this research is based
on the partitioning of the sky into cells that are used to detect concurrence events and mark the design of
the here presented CP mitigation tool. The model has been proved in a realistic and overstressed scenario
and it has been able to find suboptimal solutions in a timeframe of 180 seconds for all the performed
experiments.

310 Int. J. Simulation and Process Modelling, Vol. 13, No. 4, 2018
Copyright © 2018 Inderscience Enterprises Ltd.
A case of a modelled saturation level for cooperative flight departures
Nina Schefers* and Juan José Ramos González Technical Innovation Cluster on Aeronautical Management, Universitat Autònoma de Barcelona, Spain Email: [email protected] Email: [email protected] *Corresponding author
Jenaro Nosedal Faculty of Liberal Arts & Professional Studies, School of Administrative Studies, York University, Canada Email: [email protected]
Abstract: Owing to increasing air traffic operations, the development of advanced decision support tools (DSTs) in air traffic management (ATM) is driven forward to guarantee that sustainable transport logistics balance airspace capacity with user demands. In this paper, the tuning of calculated-take-off times (CTOTs) as a tool for mitigating the propagation of perturbations between trajectories in dense sectors is analysed. The proposed methodology uses a powerful tool for predicting potential spatio-temporal concurrence events between trajectories over the European airspace. In the first place, the aim is to remove the detected concurrence events by considering bounded time stamp adjustments on strategic agreed points of the aircraft trajectory. In the second place, the model is extended to identify route interdependencies of over constraint topologies that could lead to a saturation event. The approach is based on a robust constraint programming model aiming to determine the feasible time stamp changes considering reference based trajectories (RBTs).
Keywords: air transportation; constraint programming; air traffic management; decision support tools; airspace capacity; trajectory based operations; air traffic control; air traffic flow management; conflict detection; scheduling; reference based trajectory; calculated take-off time; reification.
Reference to this paper should be made as follows: Schefers, N., González, J.J.R. and Nosedal, J. (2018) ‘A case of a modelled saturation level for cooperative flight departures’, Int. J. Simulation and Process Modelling, Vol. 13, No. 4, pp.310–323.
Biographical notes: Nina Schefers received her Bachelor in International Information Management from the Universität Hildesheim, Germany in 2013 and her Master in Logistics and Supply Chain Management from the Universitat Autonoma de Barcelona (UAB), Spain in 2015. Currently, she is a PhD candidate at UAB with research work related to aeronautics and logistics. Her research subject is related to decision making and optimisation of processes in logistics, manufacturing and transportation.
Juan José Ramos González is a researcher focusing on modelling, simulation and optimisation of dynamic systems, especially in the field of logistics. He received his PhD from the Universitat Autonoma de Barcelona (UAB), Spain in 2003, where he is a Professor at the Dept. of Telecommunication and System Engineering. He is currently the Program Director of the European Master on Logistics and Supply Chain Management at UAB. He is a member of LogiSim, a recognised research group on modelling and simulation of complex systems. Furthermore, he is an expert in production technologies/logistics, intelligent transport systems, information and communication technology, industrial collaboration and technology transfer. He is a co-founder of Aslogic S.L.
Jenaro Nosedal-Sánchez received his Bachelor and Master in Industrial Engineering from National Autonomous University of Mexico (UNAM) and PhD from Universitat Autonoma de Barcelona, Spain. As Deputy Director of High Impact Projects at Mexico’s National Council of Science and Technology, he was responsible for funding management for R&D projects related to aeronautics and airport management. Currently, he is a Postdoctoral Fellow at York University, Canada. His research line is modelling and simulation for process improvement in management, logistics, manufacturing and transport systems.

A case of a modelled saturation level for cooperative flight departures 311
This paper is a revised and expanded version of a paper entitled ‘An efficient constraint programming model for cooperative flight departures’ presented at HMS2016 in Larnaca, Cyprus, 26–28 September.
1 Introduction As stated in the European ATM Master Plan, aviation is an important driver of economic growth predicted to have steady growth in the next decades. Therefore, the expansion of the air traffic management (ATM) system towards a performance-driven and technologically enhanced architecture is inevitable to acquire greater connectivity and to ensure the sustainability of the aviation sector in Europe as stated in Sesar (2015). The intention of the here presented innovative approach is to enhance the design of a competitive ATM system by supporting up to a certain extent the Airspace User (AU) demands at the right time (i.e., departure slots), at the right cost (i.e., suitable level of Air Traffic Control (ATC) service) at the right place (i.e., AU’s preferred trajectories) and at the right service quality (i.e., safety). This is achieved without extra investments, just by removing the ATM non-added-value operations (e.g. control, storage or transfer, etc. Tajini et al., 2014) which indirectly impacts on present ATM capacity.
By empowering the concept of trajectory-based operations (TBO) as a flexible synchronisation mechanism towards an efficient and competitive ATM service a precise description of an aircraft path in space and time can be retrieved. Under the TBO approach, airspace users should fly precise 4-dimensional trajectories (4DTs), previously agreed upon with the network manager (SKYbrary, 2017).
Europe has some of the busiest airspace in the world, compiled from 44 member states united in the European Civil Aviation Conference (ECAC) region. The Network Manager Operations Centre receives, processes and distributes up to 35,000 flight plans a day. This concerns over 500 European airports and airfields as described in (Eurocontrol, 2017). To safely operate this demand any AU that intents to depart from, arrive at or overfly one of the ECAC member states must submit a flight plan that must be approved in advance. Once the flight plan has been approved, the Reference Business Trajectory (RBT) is agreed and the aircraft is authorised to proceed in accordance with the RBT consisting of predefined conflict free segments (Cook, 2007).
The ATM network is designed to be robust and resilient to a whole range of disturbances, however, due to its dynamic and complexity, unforeseen disruption can occur at any time and influence its functionality. Delay causes can be found for example in the rotation of aircraft, in the turnaround processes, in Air Traffic Flow Management (ATFM) and Air Traffic Control (ATC) restrictions, in maintenance problems and weather conditions. When the delays exceed the agreed green delay of [–5, 10] minutes, the aircraft must be rescheduled as stated in Nosedal et al. (2014) and Barnier and Allignol (2009).
1.1 State of the art
The development of DSTs to mitigate perturbations between trajectories in a dense airspace has be a relevant topic for research projects and academic studies over the last years, due to the envisioned demand growth researchers from all over the world are working in the field of ATM to enable safety and efficient operations under a more flexible and competitive context. Studies have been made to understand the benefits that the TBO concept provides for strategic deconfliction. For example, the introduction of collaborative decision making (CDM) mechanisms to improve airport and airspace capacity and efficiency.
On the latest USA/Europe air traffic management research and development seminar (ATM, 2017; Xu and Prats, 2017) presented a strategy to include linear holding (LH) into air traffic flow management (ATFM) initiatives, together with the commonly used ground holding and airborne holding measures with the conclusion that incorporating the LH means that more space and periods in the network can be used to absorb delays. Also, Yan and Xavier (2017) provide some results about the implementation of LH for flights initially subject to ground holding, in the context of TBO. The aim of this combined approach is to neutralise additional delays raised from the lack of coordination between various traffic management initiatives (TMIs) and without incurring extra fuel consumption.
Despite LH techniques, Marcella et al. (2017) studied the real-time optimisation of take-off and landing operations at a busy terminal control area in case of traffic congestion. The approach tries to highlight the current aircraft scheduling practice suffers a lack of intelligent decision support by finding good compromise solutions among the various indicators.
Also, other researchers have been assessing rerouting algorithms to solve air traffic congestion as part of the methodologies to use the TBO concept for concurrence event deconfliction. For example in Adacher et al. (2017), graph theory was used to model the air traffic infrastructures to understand the effects of rerouting to solve congestion.
Other techniques have been used to model conflict resolution scenarios based on the TOB concept relaying on CP formalism. Barnier and Allignol (2012) for example presented a ground holding approach to solve all potential conflicts occurring above a given flight level for a day of traffic in the French airspace. Rather than trying to respect sector capacity constraints, each possibly conflicting situation between any two aircraft was modelled based on the TBO concept. The resulting problem size however was huge and therefore, Nosedal et al. (2014, 2015) introduced new mechanisms to detect concurrence events in a more efficient way using a cell system. Based on these findings,

312 N. Schefers et al.
this paper introduces a new CP model, based on an efficient concurrence event detection mechanism, able to mitigate concurrence events over the entire European airspace. Based on the CP proposed, the problem takes the form of a scheduling problem where the solution is provided by proposing small adjustment on the CTOT and also by allowing limited speed changes in order to meet the TTA. The present work proposes an improved model to solve the problem by describing the trajectory as a sequence of time intervals that represent the conflict-free segments and concurrence events segments. The scheduling consists of ensuring no concurrent use of the areas that were in conflict.
2 Problem description The here presented approach uses as a window of opportunity the agreed green delay time slot of [–5, 10] minutes and reschedules aircraft on the ground in such a way that en-route concurrence events are minimised while the AU preferred RBT is preserved. Small adjustments within the [–5, 10] interval around the calculated take-off time (CTOT), along with bounded modifications on the flight duration, will be considered in the here presented model. The goal of this approach is to significantly reduce the amount of ATC interventions and to maximise adherence of trajectories at key waypoints. Therefore, two kinds of time adjustments are considered in the constraint programming (CP) model:
1 Introduction of ground delays with a time offset of [–5, 10] minutes, remaining in the boundary of green delays to achieve fairness between airlines, since greater delays are quite unpopular as they can be very costly, can cause discomfort among passengers, and affect the strategic airspace configuration.
2 Slight modifications on time stamps for relevant trajectory points. Since a simple shifting of the whole trajectory does not contribute in preserving the target time of arrival (TTA), a more flexible approach is proposed considering additional small time adjustments at strategic points to have a control over the time-to-overfly (TTO) on relevant points close to the hotspot areas.
Using this approach, the goal of reaching the TTA on time as expressed in the ATM concept could be guaranteed by combining the relaxation of the CTOT and the total flight duration as can be seen in Figure 1. The relevant points are identified according to the potential concurrence events that are computed in the detection of tight trajectory interdependencies. Moreover, the TTO stamp of these points is calculated by the conjunction of both the CTOT and the duration of the segments that separate these concurrence events. This approach leads to the resolution of tight interdependencies maximising the trajectory adherence at the waypoints.
Figure 1 Dynamics of CTOT, segments, points with a TTO stamp and a TTA stamp (see online version for colours)
The depicted problem belongs to the class of Constraint Satisfaction Problems (CSP) see Bessiere (2006). During the mapping process, a list of proximate events is detected: Two or more aircraft losing the separation minima. This situation can be represented in terms of constraints able to describe the conditions to be met to avoid such proximate events. For removing these interdependencies, the approach proposes two action mechanisms, that is, two kinds of decision variables for adjusting the relevant time stamps in a way that the constraints modelling the interdependencies are satisfied.
Moreover, this problem can be considered as an optimisation problem, since maximising the adherence of RBTs is set as a goal. Since the decision variables belong to the integer domain, the overall problem falls in the category of combinatorial problems (Huang and Zhao, 2016; Arfi et al., 2016). Finally, for understanding the potential solver incompleteness, the model is tested introducing reification constraints to visualise unsolved concurrence events reaching saturation levels. Reification is a CP technique with the availability to transform a constraint to a 1/0 variable where 1 refers to the constraint being true and 0 otherwise.
The research goal of this paper is to develop a constraint programming model that is capable to remove the detected concurrence events by considering bounded time stamp adjustments on strategic agreed points of the aircraft trajectory and to identify saturation events.
The paper is organised as follows: Section 2 explains the methodology description to retrieve the input for the CP model. Section 3.1 describes the constraint model that has been developed to tackle the problem considering one degree of freedom and Section 3.2 outlines the extension of the model introducing speed changes between segments. Section 4 discusses the observations that were made when applying the model and Section 5 extends the model with an analysis of the solver using reification constraints for potential saturation situations. Conclusions and opportunities for further work are discussed in Section 6.
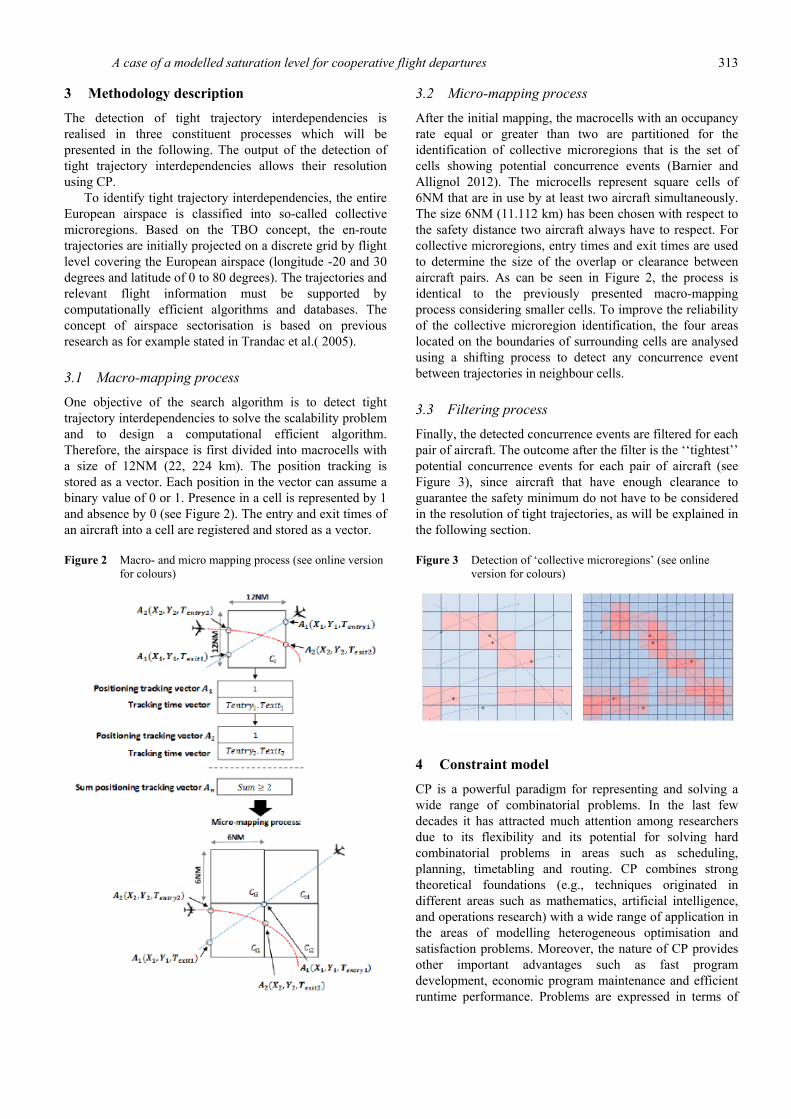
A case of a modelled saturation level for cooperative flight departures 313
3 Methodology description The detection of tight trajectory interdependencies is realised in three constituent processes which will be presented in the following. The output of the detection of tight trajectory interdependencies allows their resolution using CP.
To identify tight trajectory interdependencies, the entire European airspace is classified into so-called collective microregions. Based on the TBO concept, the en-route trajectories are initially projected on a discrete grid by flight level covering the European airspace (longitude -20 and 30 degrees and latitude of 0 to 80 degrees). The trajectories and relevant flight information must be supported by computationally efficient algorithms and databases. The concept of airspace sectorisation is based on previous research as for example stated in Trandac et al.( 2005).
3.1 Macro-mapping process
One objective of the search algorithm is to detect tight trajectory interdependencies to solve the scalability problem and to design a computational efficient algorithm. Therefore, the airspace is first divided into macrocells with a size of 12NM (22, 224 km). The position tracking is stored as a vector. Each position in the vector can assume a binary value of 0 or 1. Presence in a cell is represented by 1 and absence by 0 (see Figure 2). The entry and exit times of an aircraft into a cell are registered and stored as a vector.
Figure 2 Macro- and micro mapping process (see online version for colours)
3.2 Micro-mapping process
After the initial mapping, the macrocells with an occupancy rate equal or greater than two are partitioned for the identification of collective microregions that is the set of cells showing potential concurrence events (Barnier and Allignol 2012). The microcells represent square cells of 6NM that are in use by at least two aircraft simultaneously. The size 6NM (11.112 km) has been chosen with respect to the safety distance two aircraft always have to respect. For collective microregions, entry times and exit times are used to determine the size of the overlap or clearance between aircraft pairs. As can be seen in Figure 2, the process is identical to the previously presented macro-mapping process considering smaller cells. To improve the reliability of the collective microregion identification, the four areas located on the boundaries of surrounding cells are analysed using a shifting process to detect any concurrence event between trajectories in neighbour cells.
3.3 Filtering process
Finally, the detected concurrence events are filtered for each pair of aircraft. The outcome after the filter is the ‘‘tightest’’ potential concurrence events for each pair of aircraft (see Figure 3), since aircraft that have enough clearance to guarantee the safety minimum do not have to be considered in the resolution of tight trajectories, as will be explained in the following section.
Figure 3 Detection of ‘collective microregions’ (see online version for colours)
4 Constraint model CP is a powerful paradigm for representing and solving a wide range of combinatorial problems. In the last few decades it has attracted much attention among researchers due to its flexibility and its potential for solving hard combinatorial problems in areas such as scheduling, planning, timetabling and routing. CP combines strong theoretical foundations (e.g., techniques originated in different areas such as mathematics, artificial intelligence, and operations research) with a wide range of application in the areas of modelling heterogeneous optimisation and satisfaction problems. Moreover, the nature of CP provides other important advantages such as fast program development, economic program maintenance and efficient runtime performance. Problems are expressed in terms of
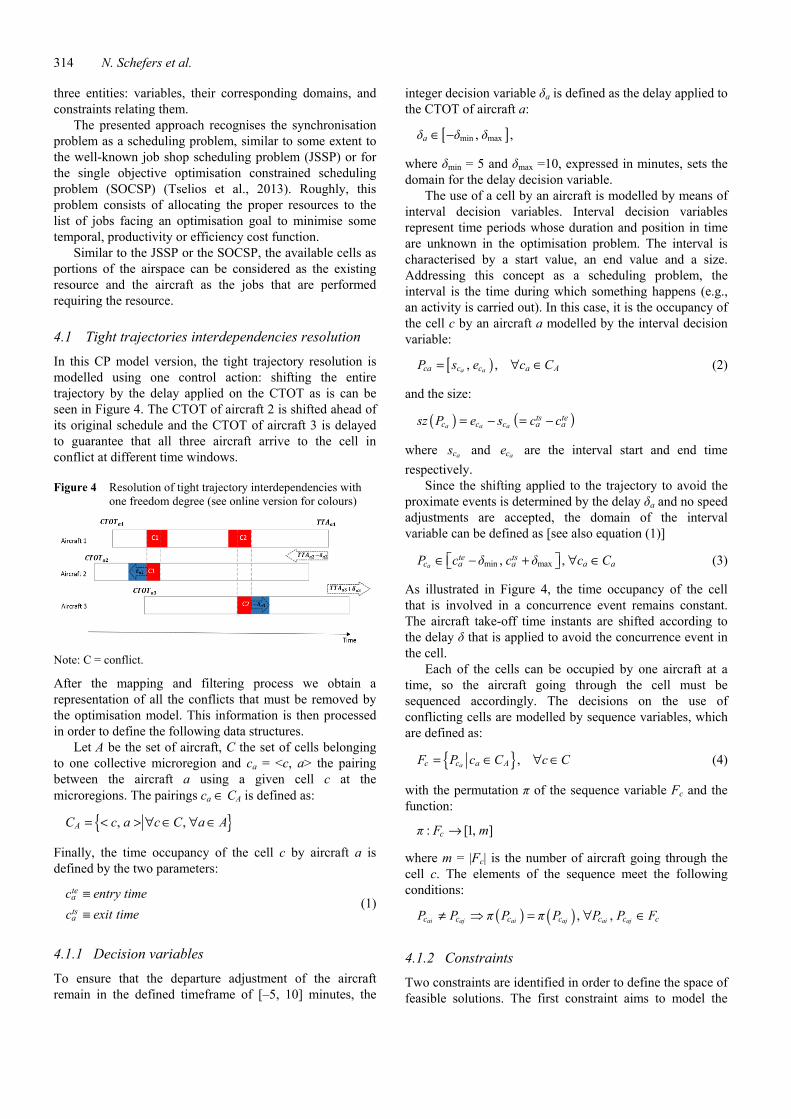
314 N. Schefers et al.
three entities: variables, their corresponding domains, and constraints relating them.
The presented approach recognises the synchronisation problem as a scheduling problem, similar to some extent to the well-known job shop scheduling problem (JSSP) or for the single objective optimisation constrained scheduling problem (SOCSP) (Tselios et al., 2013). Roughly, this problem consists of allocating the proper resources to the list of jobs facing an optimisation goal to minimise some temporal, productivity or efficiency cost function.
Similar to the JSSP or the SOCSP, the available cells as portions of the airspace can be considered as the existing resource and the aircraft as the jobs that are performed requiring the resource.
4.1 Tight trajectories interdependencies resolution
In this CP model version, the tight trajectory resolution is modelled using one control action: shifting the entire trajectory by the delay applied on the CTOT as is can be seen in Figure 4. The CTOT of aircraft 2 is shifted ahead of its original schedule and the CTOT of aircraft 3 is delayed to guarantee that all three aircraft arrive to the cell in conflict at different time windows.
Figure 4 Resolution of tight trajectory interdependencies with one freedom degree (see online version for colours)
Note: C = conflict.
After the mapping and filtering process we obtain a representation of all the conflicts that must be removed by the optimisation model. This information is then processed in order to define the following data structures.
Let A be the set of aircraft, C the set of cells belonging to one collective microregion and ca = <c, a> the pairing between the aircraft a using a given cell c at the microregions. The pairings ca ∈ CA is defined as:
{ }, ,AC c a c C a A= < > ∀ ∈ ∀ ∈
Finally, the time occupancy of the cell c by aircraft a is defined by the two parameters:
tea
tsa
c entry time
c exit time
≡
≡ (1)
4.1.1 Decision variables
To ensure that the departure adjustment of the aircraft remain in the defined timeframe of [–5, 10] minutes, the
integer decision variable δa is defined as the delay applied to the CTOT of aircraft a:
[ ]min max, ,aδ δ δ∈ −
where δmin = 5 and δmax =10, expressed in minutes, sets the domain for the delay decision variable.
The use of a cell by an aircraft is modelled by means of interval decision variables. Interval decision variables represent time periods whose duration and position in time are unknown in the optimisation problem. The interval is characterised by a start value, an end value and a size. Addressing this concept as a scheduling problem, the interval is the time during which something happens (e.g., an activity is carried out). In this case, it is the occupancy of the cell c by an aircraft a modelled by the interval decision variable:
[ ), ,a aca c c a AP s e c C= ∀ ∈ (2)
and the size:
( ) ( )a a a
ts tec c c a asz P e s c c= − = −
where acs and
ace are the interval start and end time respectively.
Since the shifting applied to the trajectory to avoid the proximate events is determined by the delay δa and no speed adjustments are accepted, the domain of the interval variable can be defined as [see also equation (1)]
min max, ,a
te tsc a a a aP c δ c δ c C ∈ − + ∀ ∈ (3)
As illustrated in Figure 4, the time occupancy of the cell that is involved in a concurrence event remains constant. The aircraft take-off time instants are shifted according to the delay δ that is applied to avoid the concurrence event in the cell.
Each of the cells can be occupied by one aircraft at a time, so the aircraft going through the cell must be sequenced accordingly. The decisions on the use of conflicting cells are modelled by sequence variables, which are defined as:
{ },ac c a AF P c C c C= ∈ ∀ ∈ (4)
with the permutation π of the sequence variable Fc and the function:
: [1, ]cπ F m→
where m = |Fc| is the number of aircraft going through the cell c. The elements of the sequence meet the following conditions:
( ) ( ) , ,ai aj ai aj ai ajc c c c c c cP P π P π P P P F≠ = ∀ ∈
4.1.2 Constraints
Two constraints are identified in order to define the space of feasible solutions. The first constraint aims to model the

A case of a modelled saturation level for cooperative flight departures 315
shifting of every interval variable according to the applied delay:
( ) ,a
tec a a a As P c δ c C= + ∀ ∈ (5)
where the function s(·) is defined as the interval start time (aircraft entry to cell c):
( )a ac cs P s= (6)
The second constraint is the no overlap constraint that imposes a set of interval variables to not overlap each other in time. In this case, all aircraft in a cell c with proximate events should have no overlap:
( ) ( ) ( ) ( ) ( )i j i jc c c c cNO F π P π P e P s P⇔ < ≤ (7)
where the function e(·) is defined as the interval end time (aircraft exit from cell c):
( )a ac ce P e= (8)
and the no overlap is guaranteed for the proximate event icP
at a position prior to any jcP by constraining its exit time to
be lower or equal to the entry time of the subsequent proximate events .
jcP
4.1.3 Optimisation goal
The objective function was chosen to enhance adherence with a synchronisation mechanism. Although flexible, it does not preserve the TTA at the destination airport. Therefore, it aims to minimise the differences between actual take-off times and the planned change of the CTOTs.
The optimisation goal of the solution is to minimise the total aircraft delays, and it is formulated as follows:
1
n
a
a
δ=
(9)
where a refers to the aircraft and δa is the delay applied. The whole optimisation model is listed here:
A set of aircraft C set of cells at a collective microregion CA = {<c, a>| ∀c ∈ C, ∀a ∈ A} d.v. δa ∈ [–δmin, δmax], ∀ ∈ A
d.v. min max, ,a
te tsc a a a aP c δ c δ c C∈ − + ∀ ∈
d.v. { },ac c a AF P c C c C= ∈ ∀ ∈
minimise 1
n
aaδ
=
subject to {
( ) ,a
tec a a a As P c δ c C= + ∀ ∈
,i jc c cP P F∀ ∈
( ) ( ) ( ) ( ) ( )i j i jc c c c cNO F π P π P e P s P⇔ < ≤
}
This model was applied and successfully solved an over-stressed realistic scenario. The scenario was composed of a set of 4,010 real 4D trajectories in the European airspace for a time window of 2 hours, showing more than 65,000 proximate events. Nevertheless, the modified trajectories do not meet the TTA, since no speed adjustment possibility is included in this model. The next section extends the model to improve the RBT adherence of the modified trajectories.
4.2 Tight trajectory interdependencies resolution
with speed adjustments
TTA adherence is a main objective to enhance capacity at arrival airports. Clearly, the TTA cannot be preserved by shifting the CTOT and therefore, the full trajectory. The TTA in ATM has a small margin of [–1, 1] minute. Therefore, its compliance is of high importance. To meet these conditions, the model described in Section 3.1 has been extended by introducing the concept of segments for describing the full trajectory from departure (CTOT) until the arrival time to the destination (TTA). Figure 5 illustrates this concept. For instance, aircraft 1 in the figure is divided into five segments: C1 and C2 represent the concurrence events while S1, S2 and S3 are the segments between the concurrence events. In the modified trajectory, the segment S1' is shifted according to the applied delay on the CTOT to avoid the first concurrence event while S3' is shortened in time by speed change in order to preserve the TTA within the margin. The intermediate segment S2’ is extended in time by flying with reduced speed to avoid concurrence event C2.
Figure 5 Resolution of tight trajectory interdependencies with speed change (see online version for colours)
Notes: C = conflict; S = segment; Sz = size.
The speed adjustments are realised under the condition that the segments between proximate events are of a certain minimum duration. That allows for the introduction of a speed change that is efficient in terms of fuel consumption and in the effect on the resolution of the conflict while trying to preserve the TTA.
New data structures are included to model the trajectory segments for speed adjustments. Let ˆ a
ig be a segment of the aircraft a trajectory. Therefore, the RBT can be noted as:
{ }ˆ , 1.. ( )aa iRBT g i p a= =
where p(·) is the number of segments required for describing the trajectory. For instance, Figure 7 shows the

316 N. Schefers et al.
trajectory segments of aircraft 1, represented as, RBTa = {S1, C1, S2, C2, S3} with
( )
( )
ˆ ˆstart time of ,ˆ ˆ
a ai i
a ai i
s g g
e g end time of g
=
=
where the functions s(·) and e(·) yield the start and end times of the corresponding RBT segments [see equations (7) and (9) for the function definition].
Finally, the concept of segment elasticity ˆ( )ail g is
introduced to denote the allowed speed variation as a percentage of the ˆ a
ig segment duration ˆ( ).aisz g
4.2.1 Additional decision variables
In this new CP model approach, the duration of the entire flight becomes an unknown itself, since CTOT can be delayed while keeping the intent to preserve the TTA.
A decision interval variable Ga is introduced for representing the entire flight:
[ ),a a aG s e=
where sa will be the take-off time and ea the arrival time in the solution.
Secondly, the interval variables representing the segments of the Ga solution trajectory are modelled. Let a
ig be the interval variable:
( ) ( )),a a ai i ig s g e g=
and the size of the aig segment is:
( ) ( ) ( )a a ai i isz g e g s g= −
The domain of the aig segment can be defined as:
( ) ( ) ( ) ( ) ( )ˆ ˆ ˆ ˆ,a a a a ai i i i isz g sz g l g sz g l g ∈ − + (10)
Note that in this model version, interval duration can differ from RBT segment duration, since some elasticity is enabled by the bounded speed changes, whereas the domain for the interval start and end time cannot be specified, since their values at the solution are a combination of the take-off delay and the bounded speed adjustments.
Finally, a sequence variable Ta is introduced to set the relationship between the trajectory segments a
ig and the entire trajectory Ga:
{ }
( ) ( )
, 1.. ( )
: [1, ], ,
aa i
a
a a a a a aai j i j i j
T g a A i p a
π T n
g g π g π g g g T
= ∀ ∈ ∈
→
≠ ≠ ∀ ∈
(11)
4.2.2 Additional Constraints for speed change
The duration of the flight is determined by the constraint of the take-off time and the time of arrival.
( )a a as G CTOT δ= ± (12)
( ) [ ]1, 1a a ae G TTA TTA∈ − + (13)
The relationship between the flight interval variable and its segments is modelled by the following span condition:
{ }( ), , ,a aa ai ispan G g a A g T∀ ∈ ∀ ∈
This constraint sets the following time relationship among the interval variables:
( )[ ]
( ){ }( )
( )[ ]
( ){ }( )1, ( )
1, ( )
min
max
aa i
i p a
aa i
i p a
s G s g
e G e g
∈
∈
= =
(14)
The constraint span states that the interval flight spans over all present intervals from the set segments. That is, interval flight Ga starts together with the first present segment interval and ends together with the last one.
Additionally, the following three constraints are set to order the trajectory segments:
1 The no overlap constraint to ensure that interval variables do not overlap each other.
( ) ( ) ( ) ( ) ( )a a a aa i j i jNO G π g π g e g s g⇔ < ≤ (15)
2 The constraint that one segment has to start before the next:
( ) ( ) , , :a ai je g s g i j i j≤ ∀ ≤ (16)
3 The constraint that ensures that the start of segment j results after the end of segment i.
( ) ( ) , , : 1a ai je g s g i j j i= ∀ = + (17)
The graphical representation of these three constraints is shown in Figure 6. Aircraft 1 has a flight duration and the projection of the segments onto the flight duration with the three conditions is shown.
Figure 6 Representation of function flight and RBT segments (see online version for colours)
Finally, the acP interval variable, that is used in
combination with the sequence variable Fc to remove the concurrence events at cell c, must be linked with the concurrence segments of the trajectory Ta (e.g. C1 and C2 in

A case of a modelled saturation level for cooperative flight departures 317
Figure 6), since they represent the same time windows. This is accomplished by the following constraint:
( ) ( ) ( )
( ) ( ) ( )
ˆ,
ˆ
ea
sa
ta ac ai i
a A
ta ac ai i
s g s P s g c
c c
e g e P e g c
= =
⇔ ∀ ∈ = =
4.2.3 Objective function
The constraint in equation (10) binds to the TTA attainment. However, it might happen that no solution is found because time adjustment is bounded so it is possible that the required delay δa cannot be compensated by the speed adjustments. For this reason, the TTA constraint is relaxed. The following logical function is added:
( )( ) [ ]1, 1, 1
0, otherwisea a a
a
e G TTA TTAL G
∉ − +=
With this function, the number of TTA violations can be counted. Minimising this function and combining it with the objective function stated in equation (9), a new combined objective function is defined. This function minimises the total delay of the aircraft take-offs and minimises the number of TTA violations. The following equation weighs both objectives to get the optimisation goal:
( )1 21 1
minn n
a a
a a
w δ w L G
= =
+ (18)
The extended optimisation model is listed here: A set of aircraft C set of cells at a collective microregion CA = {<c, a>| ∀c ∈ C, ∀a ∈ A}
{ }ˆ , 1aa iRBT g a A i= ∀ ∈ =
d.v. δa ∈ [–δmin, δmax], ∀ ∈ A
d.v. min max, ,a
te tsc a a a aP c δ c δ c C∈ − + ∀ ∈
d.v. { },ac c a AF P c C c C= ∈ ∀ ∈
d.v. ,aG a A∀ ∈
d.v. ( )( ) ( )
( ) ( )
ˆ ˆ ,, , 1.. ( ) :
ˆ ˆ
a ai i
a ai i
a ai i
sz g l gg a A i p a sz g
sz g l g
−∀ ∈ ∀ ∈ ∈
+
d.v. { },aa iT g a A= ∀ ∈
minimise
( )1 21 1
n n
a aa a
w δ w L G= =
+
subject to { ( )a
i a as g CTOT δ a A= ± ∀ ∈
,i jc c cP P F∀ ∈
( ) ( ) ( ) ( ) ( )i j i jc c c c cNO F π P π P e P s P⇔ < ≤
{ }( ), , ,, , 1.. ( )
a aa ai ispan G g a A g T
a A i j p a
∀ ∈ ∀ ∈
∀ ∈ ∀ ∈
( ) ( ) ( ) ( ) ( )a a a aa i j i jNO G π g π g e g s g⇔ ≤ ≤
( ) ( ) :a ai je g s g i j≤ ≤
( ) ( ) : 1a ai je g s g j i= = +
( ) ( ) ( )
( ) ( ) ( )
ˆ,
ˆ
ea
sa
a a ti c i a
a A
a a ti c i a
s g s P s g c
c c
e g e P e g c
= =
⇔ ∀ ∈ = =
}
5 Application of the model The model was applied to an over-stressed realistic scenario. The scenario was composed of a set of 4,010 real 4D trajectories in the European airspace for a time window of 2 h. In this work, we assumed TBO without uncertainties. In this context, the trajectories were discretised at each second, and each position was specified in terms of geographic coordinates and a time stamp. This scenario was designed and analysed in the STREAM project (Ranieri et al. 2011), a EUROCONTROL SESAR WP-E project. The CP model has been implemented with the ILOG Optimisation Suite (IBM, 2015) and the following results were obtained.
5.1 Macro and micro mapping
The detection of concurrence events in this paper is based on the algorithms and results presented at Nosedal et al. (2014) and Nosedal et al. (2015). The aforementioned 2h scenario leads to the detection of collective microregions. These microregions have been used to find the optimal CTOT adjustments and speed changes to reduce proximate events and, therefore, possible ATC interventions.
In Figure 7(a) the en-route traffic through the collective microregions is shown. The cells with potential concurrence events are detected based on the RBT trajectories of those aircraft ready to depart, but still on ground, according to their CTOT. Therefore, en-route trajectories are conflict free at the given time instant.
Figure 7(b) shows the situation found when the grounded aircraft depart according to their RBT CTOT. As it can be seen, for instance, at cells 12,241, 12,449 and 12,450 among others, concurrence events will appear between several aircraft if they depart according to their CTOT. In this case, aircraft regulations could be issued by ATM or, later on, ATC interventions would be needed to remove the proximate events caused by the inserted traffic.
5.2 Trajectory adjustments
The proposed CP model is used to determine the proper adjustments on the CTOT and aircraft trajectories to remove the potential concurrence events.

318 N. Schefers et al.
As Figure 8 illustrates, all the potential concurrence events are removed by applying a combination of bounded
delays on CTOT and/or speed adjustments, leading to a conflict free scenario.
Figure 7 Gantt diagrams showing the traffic through the cells with potential concurrence events, diagram (a) shows the conflict free en-route traffic and (b) shows the emerging conflict after inserting the departing traffic for the same time period (see online version for colours)
(a)
(b)
Figure 8 The diagram shows the conflict free solution after applying small adjustments on CTOT and segment’ speed (see online version for colours)

A case of a modelled saturation level for cooperative flight departures 319
Figure 9 (a) The Gantt diagram shows the full flight interval of the aircraft in potential concurrence events (b) The diagram shows their segment structure (see online version for colours)
(a)
(b)
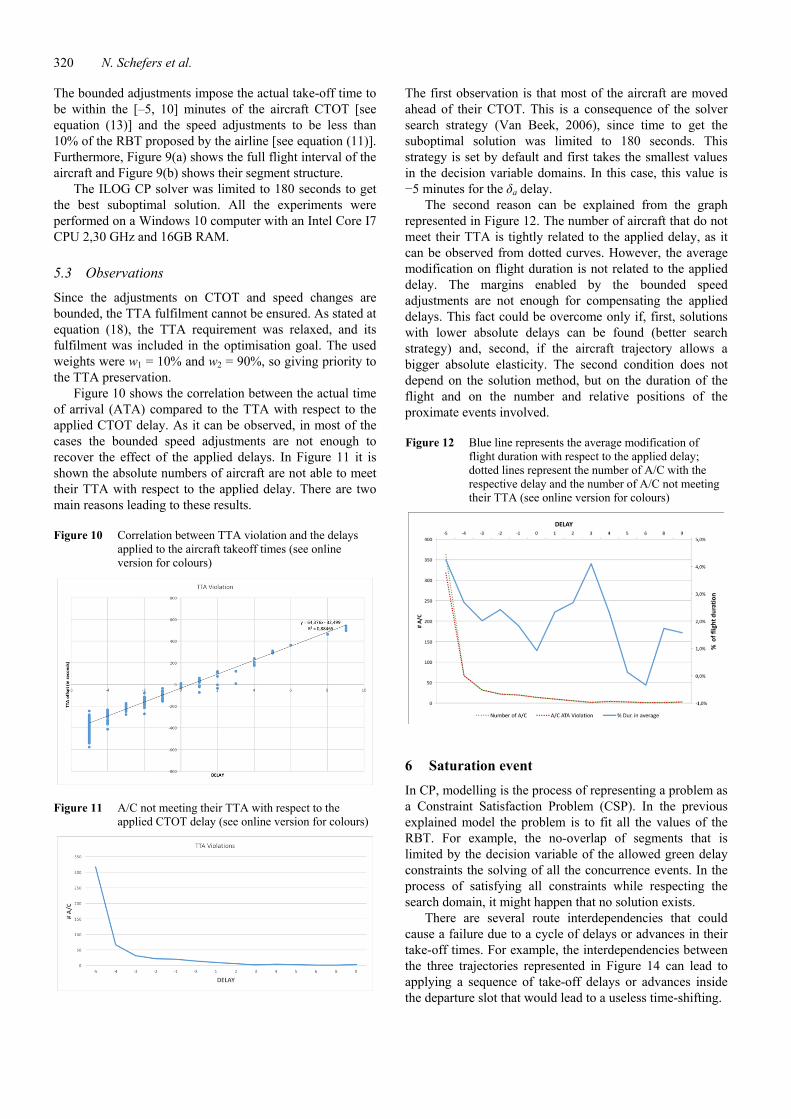
320 N. Schefers et al.
The bounded adjustments impose the actual take-off time to be within the [–5, 10] minutes of the aircraft CTOT [see equation (13)] and the speed adjustments to be less than 10% of the RBT proposed by the airline [see equation (11)]. Furthermore, Figure 9(a) shows the full flight interval of the aircraft and Figure 9(b) shows their segment structure.
The ILOG CP solver was limited to 180 seconds to get the best suboptimal solution. All the experiments were performed on a Windows 10 computer with an Intel Core I7 CPU 2,30 GHz and 16GB RAM.
5.3 Observations
Since the adjustments on CTOT and speed changes are bounded, the TTA fulfilment cannot be ensured. As stated at equation (18), the TTA requirement was relaxed, and its fulfilment was included in the optimisation goal. The used weights were w1 = 10% and w2 = 90%, so giving priority to the TTA preservation.
Figure 10 shows the correlation between the actual time of arrival (ATA) compared to the TTA with respect to the applied CTOT delay. As it can be observed, in most of the cases the bounded speed adjustments are not enough to recover the effect of the applied delays. In Figure 11 it is shown the absolute numbers of aircraft are not able to meet their TTA with respect to the applied delay. There are two main reasons leading to these results.
Figure 10 Correlation between TTA violation and the delays applied to the aircraft takeoff times (see online version for colours)
Figure 11 A/C not meeting their TTA with respect to the applied CTOT delay (see online version for colours)
The first observation is that most of the aircraft are moved ahead of their CTOT. This is a consequence of the solver search strategy (Van Beek, 2006), since time to get the suboptimal solution was limited to 180 seconds. This strategy is set by default and first takes the smallest values in the decision variable domains. In this case, this value is −5 minutes for the δa delay.
The second reason can be explained from the graph represented in Figure 12. The number of aircraft that do not meet their TTA is tightly related to the applied delay, as it can be observed from dotted curves. However, the average modification on flight duration is not related to the applied delay. The margins enabled by the bounded speed adjustments are not enough for compensating the applied delays. This fact could be overcome only if, first, solutions with lower absolute delays can be found (better search strategy) and, second, if the aircraft trajectory allows a bigger absolute elasticity. The second condition does not depend on the solution method, but on the duration of the flight and on the number and relative positions of the proximate events involved.
Figure 12 Blue line represents the average modification of flight duration with respect to the applied delay; dotted lines represent the number of A/C with the respective delay and the number of A/C not meeting their TTA (see online version for colours)
6 Saturation event In CP, modelling is the process of representing a problem as a Constraint Satisfaction Problem (CSP). In the previous explained model the problem is to fit all the values of the RBT. For example, the no-overlap of segments that is limited by the decision variable of the allowed green delay constraints the solving of all the concurrence events. In the process of satisfying all constraints while respecting the search domain, it might happen that no solution exists.
There are several route interdependencies that could cause a failure due to a cycle of delays or advances in their take-off times. For example, the interdependencies between the three trajectories represented in Figure 14 can lead to applying a sequence of take-off delays or advances inside the departure slot that would lead to a useless time-shifting.

A case of a modelled saturation level for cooperative flight departures 321
In Figure 13 the overlap and clearances of an over-constraint topology in the form of a triangle is represented using a temporal representation. The triangle is formed of three conflict cells that are all interconnected. The corner points of the triangle are the concurrence events between a1 and a2, between a1 and a3 and between a2 and a3.
Figure 13 Temporal representation of an over-constraint triangle topology (see online version for colours)
In the following an approach is presented to identify the occurrence of saturation by introducing the CP modelling technique reification.
To model this problem, logical connectives between constraints are required e.g. the RBT should span over the whole duration of the flight AND one segment of the RBT must start before the next. In some cases, it is useful to apply a NOT constraint to the problem which in CSP is done by the means of reification. The reification of a constraint C produces another constraint Cr, such that Cr has an extra Boolean variable r in its variable set, and (in any solution) r is set to true if and only if the original constraint C is satisfied, see (Jefferson et al., 2017).
To model the clearance that exists between aircraft that are involved in a concurrence event a new decision variable is introduced representing the clearances ℎ of all conflicts.
[ ]Ah C∈ (19)
To identify a possible saturation level of cells with the above presented model, a binary decision variable Xa with the domain Xa = [0, 1] for all aircraft a has been introduced. Furthermore, the separation constraint [see equations (21) and (22)] and the departure constraint [see equation (20)] have been modified introducing the concept of reification.
The constraint that models the shifting of every interval variable has been modified in a way that if Xa has the value 0, then the CTOT is not modified, see equation (20).
( ) * [ ],a
tec a a a As P c δ X a c C= + ∀ ∈ (20)
Also, the separation constraint of aircraft passing through one cell was separated in a way that the RBT is only modified if and only if Xa has the value 1, see equations (21) and (22). Furthermore, the occupancy of the cell c by an aircraft a with its size defined by the start and end time has been extended in a way that if the overlap of the aircraft was solved by the no overlap constraint than the exit time of the first aircraft ai using the cell c is smaller than the entry time
of the second aircraft aj and the difference between the entry time of aj and the exit time of ai is greater than the clearance h of all conflicts and the other way around.
( ) ( )
( ) ( ) [ ]
1 1i i j
j i
c cj c c
c c A
X X e P s P
s P e P h C
= ∧ = ∧ ≤
− ≥ (21)
( ) ( )
( ) ( ) [ ]
1 1i j i
i j
c cj c c
c c A
X X e P s P
s P e P h C
= ∧ = ∧ ≤
− ≥ (22)
The optimisation goal of the solution is to maximise the minimum clearance (w1) and at the same time to minimise the number of relaxed trajectories since the sum of Xi is maximised (w2). The objective function is formulated as follows:
[ ]1 2max mina
A ic
w h C w X+ (23)
The extended optimisation model is listed here:
A set of aircraft C set of cells at a collective microregion CA = {<c, a>| ∀c ∈ C, ∀a ∈ A}
{ }ˆ , 1.. ( )aa iRBT g a A i p a= ∀ ∈ =
d.v. δa ∈ [–δmin, δmax], ∀a ∈ A
d.v. min max, ,a
te tsc a a a aP c δ c δ c C∈ − + ∀ ∈
d.v. { },ac c a AF P c C c C= ∈ ∀ ∈
d.v. ,aG a A∀ ∈
d.v. ( )( ) ( )
( ) ( )
ˆ ˆ ,, , 1.. ( ) :
ˆ ˆ
a ai i
a ai i
a ai i
sz g l gg a A i p a sz g
sz g l g
−∀ ∈ ∀ ∈ ∈
+
d.v. { },aa iT g a A= ∀ ∈
d.v. h ∈ [CA] minimise [ ]1 2min
a
A ic
w h C w X+
subject to { ( )a
i a as g CTOT δ a A= ± ∀ ∈
,i jc c cP P F∀ ∈
( ) ( ) ( ) ( ) ( )i j i jc c c c cNO F π P π P e P s P true⇔ < ≤ =
( ) ( ) ( ) ( ) [ ]i j j ic c c c Ae P s P s P e P h C≤ − ≥
( ) ( ) ( ) ( ) [ ]j i i jc c c c Ae P s P s P e P h C≤ − ≥
{ }( ), , ,, , 1.. ( )
a aa ai ispan G g a A g T
a A i j p a
∀ ∈ ∀ ∈
∀ ∈ ∀ ∈
( ) ( ) ( ) ( ) ( )a a a aa i j i jNO G π g π g e g s g⇔ ≤ ≤
( ) ( ) :a ai je g s g i j≤ ≤
( ) ( ) : 1a ai je g s g j i= = +

322 N. Schefers et al.
( ) ( ) ( )
( ) ( ) ( )
ˆ,
ˆ
ea
sa
a a ti c i a
a A
a a ti c i a
s g s P s g c
c c
e g e P e g c
= =
⇔ ∀ ∈ = =
}
6.1 Application and experimental results
The algorithm was applied on a set of 23 aircraft that in attempt to solve the conflict scenarios reach saturation level. That is for example to model a very frequent throughput of one specific cell of traffic. The traffic in this cell is en-route and therefore, the departure time cannot be modified anymore. In this traffic an aircraft that is ready to depart must be merged within the departure modification slot of [–5, 10] minutes.
After running the algorithm, the throughput of the cell reveals that the conflict could not be solved as demonstrated in Figure 14. The throughput of the aircraft en-route through the cell is performed sequentially with no overlaps. The aircraft that has to be inserted in the en-route traffic (see the segment on the bottom in the middle of Figure 15) remains in conflict with the other traffic.
Figure 14 Unsolved conflict (see online version for colours)
The high throughput in the cell that is occupied with en-route traffic does not allow to insert the departing aircraft within its CTOT domain of [–5, 10] minutes in such a way that the concurrence event can be resolved. In such a situation, the aircraft either would have to be handled directly by ATM or the green delay domain of [–5, 10] minutes would have to be exceeded to find a suitable best solution.
7 Conclusions In this work, a CP model is presented for solving the concurrence events that might occur when the departure traffic is inserted into the en-route traffic. Compared to other models, this research is based on the partitioning of the sky into cells that are used to detect concurrence events and mark the design of the here presented CP mitigation tool. The model has been proved in a realistic and overstressed scenario and it has been able to find suboptimal solutions in a timeframe of 180 seconds for all the performed experiments.
The model constraints ensure that all the proximate events are resolved by introducing small time adjustment both on the CTOT and relevant TTO’s while maximising the adherence to the RBT’s. Although the model is not able to ensure that the ATM concept of preserving the TTA in a strict time frame is met, the CP solver can find solutions that remove all the conflicts reducing the number of potential ATC interventions.
The concept of preserving the TTA has been relaxed and the objective function penalises the TTA violation. The reason for this is the limit of the trajectory elasticity, since speed adjustments are bounded to a percentage of the total RBT duration.
Finally, the concept of reification was introduced to the model to detect potential saturation levels of conflict scenarios. Due to strict safety requirements in air traffic the detection of these saturations is essential to ensure that all potential conflicts are eliminated. With the presented approach, conflict scenarios that reach saturation levels can be detected and relaxed so that other safety nets can take action to eliminate the concurrence event. In this approach only a small example of the application of reification was given. Future research has to be done to design traffic scenarios and identify geometries of aircraft that lead to saturation levels or deadlocks.
Finally, further research is required to apply different search strategies on different traffic scenarios favouring the selection of adjustments close to zero in first term. This way speed adjustment efforts are expected to be smaller. Moreover, further research is suggested to understand the cause of saturations and to develop best strategies on how to solve them.
8 Acronyms
ATC Air Traffic Control ATFM Air Traffic Flow Management ATM Air Traffic Management AU Airspace User CP Constraint Programming CSP Constraint Satisfaction Problems CTOT Calculated-Take-Off Time DST Decision Support Tool JSSP Job Shop Scheduling Problem LH Linear Holding SOCSP Single objective optimisation constrained scheduling
problem TBO Trajectory Based Operation TTA Target Time of Arrival TTO Time-To-Overfly RBT Reference Business Trajectory 4DT 4-dimensional trajectories

A case of a modelled saturation level for cooperative flight departures 323
Acknowledgements This research is supported by the European Union’s Horizon 2020 research and innovation program. The Project related to this research is PARTAKE ‘Cooperative departures for a competitive ATM network service’ with Grant Agreement No. 699307. Opinions expressed in this paper reflect author’s views only.
References Adacher, L., Flamini, M. and Romano, E. (2017) ‘Rerouting
algorithms solving the air traffic congestion advanced PID tuning based on the modulus optimum method for real systems rerouting algorithms solving the air traffic congestion’, International Conference on Applied
Mathematics and Computer Science AIP Conference
Proceedings AIP Conference Proceedings, Vol. 10, No. 10, pp.20053–20060 [online] https://doi.org/10.1063/1.4981993 (accessed 25 November 2017).
Arfi, F., Ilié, J.M. and Saidouni, D.E. (2016) ‘Solving preemptive job-shop scheduling problems using a true concurrency model’, International Journal of Simulation and Process
Modelling, Vol. 11, Nos. 3/4, p.292 [online] http://www.inderscience.com/link.php?id=78507 (accessed 24 November 2017).
Barnier, N. and Allignol, C. (2009) ‘4D-trajectory deconfliction through departure time adjustment’, Europe Air Traffic
Management Research and Development Seminar [online] https://hal-enac.archives-ouvertes.fr/hal-00938231/document (accessed 23 April 2017).
Barnier, N. and Allignol, C. (2012) ‘Trajectory deconfliction with constraint programming’, Vol. 27, No. 3, pp.291–307 [online] https://hal-enac.archives-ouvertes.fr/hal-00935206/document (accessed 23 April 2017).
Bessiere, C. (2006) ‘Constraint propagation’, Handbook of
Constraint Programming, Chapter 3, pp.29–83, Elsevier. Cook, A. (2007) European Air Traffic Management: Principles,
Practice and Research [online] https://books.google.es/books/ about/European_Air_Traffic_Management.html?id=vQ9LG6TWl9oC&redir_esc=y (accessed 11 May 2017).
Eurocontrol (2017) Flight Planning|Eurocontrol [online] http://www.eurocontrol.int/articles/flight-planning (accessed 27 March 2017).
Huang, Z. and Zhao, H. (2016) ‘Construction resource scheduling with chaotic particle swarm optimisation’, International
Journal of Simulation and Process Modelling, Vol. 11, No. 1, p.1 [online] http://www.inderscience.com/link.php?id=75065 (accessed 24 November 2017).
IBM (2015) IBM ILOG CPLEX Optimization Studio OPL
Language Reference Manual, Version 12, pp.1–152 [online] https://www.ibm.com/support/knowledgecenter/SSSA5P_12.6.2/ilog.odms.studio.help/pdf/opl_langref.pdf (accessed 4 January 2018).
Jefferson, C. et al. (2017) Implementing Logical Connectives
in Constraint Programming [online] https://pn.host.cs. st-andrews.ac.uk/aij-watchedor-reify-paper.pdf (accessed 8 April 2017).
Marcella, S. et al. (2017) ‘Scheduling models for optimal aircraft traffic control at busy airports: tardiness, priorities, equity and violations considerations’, Omega, Vol. 67, pp.81–98 [online] http://www.sciencedirect.com/science/article/pii/S0305048316301165 (accessed 25 November 2017).
Nosedal, J. et al. (2014) ‘An efficient algorithm for smoothing airspace congestion by fine-tuning take-off times’, Transportation Research Part C: Emerging Technologies, Vol. 44, pp.171–184.
Nosedal, J. et al. (2015) ‘An optimization model to fit airspace demand considering a spatio-temporal analysis of airspace capacity’, Transportation Research Part C: Emerging
Technologies, Vol. 61, pp.11–28. Ranieri, A. et al. (2011) STREAM – Strategic Trajectory
De-confliction to Enable Seamless Aircraft Conflict
Management Concept, Methodology and Tools, December, pp.1–8, sesarinnovationdays.eu.
Sesar (2015) The Roadmap For delivering High Performing
Aviation For Europe European ATM Master Plan., Edition 20 [online] http://ec.europa.eu/transport/modes/air/sesar/doc/eu-atm-master-plan-2015.pdf (accessed 18 July 2016).
SKYbrary (2017) 4D Trajectory Concept – SKYbrary Aviation
Safety [online] https://www.skybrary.aero/index.php/ 4D_Trajectory_Concept (accessed 19 November 2017).
Tajini, R., Elhaq, S.L. and Rachid, A. (2014) ‘Modelling methodology for the simulation of the manufacturing systems’, International Journal of Simulation and Process
Modelling, Vol. 9, No. 4, p.285 [online] http://www.inderscience.com/link.php?id=66372 (accessed 24 November 2017).
Trandac, H., Baptiste, P. and Duong, V. (2005) ‘Airspace sectorization with constraints’, RAIRO – Operations
Research, Vol. 39, No. 2, pp.105–122 [online] http://www.rairo-ro.org/10.1051/ro:2005005 (accessed 23 April 2017).
Tselios, D.C., Savvas, I.K. and Kechadi, M.T. (2013) ‘Multiple project portfolio scheduling using recurrent neural networks’, International Journal of Simulation and Process Modelling, Vol. 8, No. 4, p.227 [online] http://www.inderscience.com/ link.php?id=59421 (accessed 24 November 2017).
Van Beek, P. (2006) ‘Backtracking search algorithms’, Handbook
of Constraint Programming, Chapter 4, pp.85–134, Elsevier B.V.
Xu, Y. and Prats, X. (2017) ‘Including linear holding in air traffic flow management for flexible delay handling’, Europe Air
Traffic Management Research and Development Seminar [online] http://www.atmseminarus.org/seminarContent/ seminar12/papers/12th_ATM_RD_Seminar_paper_139.pdf (accessed 25 November 2017).
Yan, X. and Xavier, P. (2017) ‘Effects of linear holding for reducing additional flight delays without extra fuel consumption’, Transportation Research Part D: Transport
and Environment, Vol. 53, pp.388–397 [online] http://www.sciencedirect.com/science/article/pii/S1361920916308501 (accessed 25 November 2017).

Paper 2
64

Paper 3
65
Chapter 7
7. Paper 3
This paper has been presented to the Twelfth USA/Europe Air Traffic Management Research and
Development Seminar (ATM2017) and was awarded the best paper reward. It shows a first approach to
integrate time uncertainty to the proposed detection, analysis and mitigation methodology.
Twelfth USA/Europe Air Traffic Management Research and Development Seminar (ATM2017)
A Constraint Programming Model with Time
Uncertainty for Cooperative Flight Departures
Juan J.Ramos, Nina Schefers, Marko Radanovic,
Miquel A. Piera
Dep. of Logistics and Aeronautics
Universitat Autònoma de Barcelona
Barcelona, Spain
Pau Folch
Dep. of Research and Innovation
Aslogic
Rubí, Spain
Abstract— The lack of a proper integration of strategic ATM
decision support tools with tactical ATC interventions usually
generates a negative impact in the Reference Business Trajectory
adherence, and in consequence affects the potential of the TBO
framework. In this paper, a new mechanism to reduce the amount
of ATC interventions at tactical level while preserving ATFM
planned operations is presented as part of the PARTAKE project.
The project fosters adherence of air space user’s trajectory
preferences enhancing Trajectory Based Operation (TBO)
concepts by identifying tight interdependencies between
trajectories and introducing a new mechanism to improve aircraft
separation at the hot spots. The underlying philosophy is to
capitalize present freedom degrees between layered Air Traffic
Management (ATM) planning tools, when sequencing departures
at airports by considering the benefits of small time stamp changes
in the assigned CTOT departures.
Keyword- Air traffic management; Trajectory Based Operations;
Decision Support Tool; Constraint Programming
I. INTRODUCTION
Air transport is an integral part of transport infrastructure and a significant sector of the economy predicted next decades with steady growth. Therefore, the identification of operational and managing policies for better performance of existing airspace procedures is important in order to cut European Air Traffic Management (ATM) costs, increase capacity and operational safety and decrease the environmental impact. The intention of this innovative approach is to design a competitive ATM system, supporting up to a certain extent the Airspace User (AU’s) demands at the right time (i.e. departure slots), at the right cost (i.e. suitable level of Air Traffic Control (ATC) service) at the right place (i.e. AU’s preferred trajectories) and at the right service quality (i.e. safety) without extra investments, just by removing the ATM non-added-value operations that indirectly impact on present ATM capacity.
By empowering the concept of Trajectory-based Operations (TBO) as a flexible synchronization mechanism towards an efficient and competitive ATM service a precise description of an aircraft path in space and time can be retrieved [2][7]. Under this TBO approach, airspace users should fly precise 4-dimensional trajectories (4DTs), previously agreed upon with the network manager.
The presented research is conducted in the context of the PARTAKE Exploratory Research Project supported by the European Union’s Horizon 2020 research and innovation program. Europe has some of the busiest airspace in the world, managed by a network covering 11.5 million km² of airspace [18]. The Network Manager Operations Centre receives, processes and distributes up to 35,000 flight plans a day [3]. PARTAKE aims to improve the present demand/capacity balance in ATM by introducing small ground delays in the programed departure that will not affect the planned traffic since the slot time window assigned to each aircraft will be preserved. The major challenge PARTAKE is facing is to achieve ATC minimum tactical interventions: Reference Business Trajectories (RBT) provide an excellent source of information to identify future situations in which two or more aircraft could require ATC directives to maintain the required separation minima. PARTAKE proposes mitigation methods that are able to take into account the preferences of Airlines and Airports.
This work presents a set of tools to determine small
adjustments within the [−5,10]interval around the Calculated Take-Off Time (CTOT), along with bounded modifications on the flight duration, as the control actions to be taken by considering the RBT and the impact on potential ATC interventions. These actions will be calculated to mitigate the potential tight trajectory interdependencies that can emerge after inserting the traffic ready to depart. The use of Constraint Programming (CP) [9] is proposed to calculate those feasible departure configurations. CP is an emergent software technology for declarative description and effective solving of large, particularly combinatorial, problems especially involving scheduling, resource allocation, placement and planning [5][8][11].
The paper is organized as follows: Section II briefly introduces the mapping and filtering mechanism implemented to detect the trajectory interdependencies between airborne flights and the new traffic; Section III describes the CP model proposed to mitigate the detected collective micro-regions that would require ATC interventions; Section IV proposes a model to deal with time uncertainty in the RBT; Section V discusses the experimental results achieved so far; finally, some conclusions and open questions for further research are discussed in Section VI.

II. DETECTION MECHANIM
The detection of tight trajectory interdependencies is realized in three constituent processes which will be presented in the following. The output of the detection of tight trajectory interdependencies enables the resolution of these interdependencies using CP.
To identify tight trajectory interdependencies, the entire European Airspace is classified into so called collective microregions. Based on the TBO concept, the enroute trajectories are initially projected on a discrete grid by flight level covering the European Airspace (longitude -20 and 30 degrees and latitude of 0 to 80 degrees). The trajectories and relevant flight information must be supported by computational efficient algorithms and databases.
A. Macro-mapping process
One objective of the search algorithm is to detect tight trajectory interdependencies is to solve the scalability problem and to design a computational efficient algorithm. Therefore, the airspace is divided into macrocells with a size of 12NM (22,224 km). The position tracking is stored as a vector. Each position in the vector takes a binary value. The presence in a cell is represented by 1 and absence by 0 (see Figure 1). The entry and exit times of an aircraft into a cell are registered and stored as a vector.
B. Micro-mapping process
After the initial mapping, the macrocells with an occupancy rate equal or greater than two are partitioned for the identification of collective microregions, that is the set of cells showing potential concurrent events. The microcells represent square cells of 6NM that are in use by at least two aircraft simultaneously [11]. The size 6NM (11.112 km) has been chosen with respect to the safety distance two aircraft always must respect. For collective microregions, entry times and exit times are used to determine the size of the overlap or clearance between aircraft pairs. As it can be seen in Figure 1, the process is identical to the previous presented macro-mapping process
considering smaller cells. To ensure the reliability of the collective microregion identification, the occupancy of surrounding cells is analyzed in order to detect any concurrence event between trajectories at neighbor cells.
C. Filtering process
Finally, the detected concurrence events are filtered for each pair of aircraft. The outcome after the filter are the tightest potential concurrence events for each pair of aircraft (see Figure 2). This process shall filter those trajectories either losing the required clearance (separation minima) or that are in a risk of losing it after mitigation measures are applied. The filtering process is based on the collective micro-regions that were detected in the mapping process. For these collective micro-
regions, entry (�*+) and exit (�*
,) times are used to determine the temporal looseness, referring to the size of the overlap or clearance between aircraft pairs. The calculation of the temporal
looseness � between time windows of aircraft �/and �0 in a collective micro-region is expressed as follows:
� = min �*5, , �*6
, − max(�*5+ , �*6
+ )
Concurrence events exist when � is positive, indicating an
overlap, whereas events with a negative � value have a clearance time, indicating a potential concurrence event. Based
on the calculation of � (the size of an overlap or clearance), it is possible to identify the tightest concurrence events, or potentially concurrence events, for each pair of aircraft.
III. MITIGATION PROCESS
The conflict mitigation process is modeled as Constraint Programming (CP) model [9]. CP is a powerful paradigm for representing and solving a wide range of combinatorial problems. In the last few decades it has attracted much attention among researchers due to its flexibility and its potential for solving hard combinatorial problems in areas such as scheduling, planning, timetabling and routing. CP combines strong theoretical foundations (e.g. techniques originated in different areas such as Mathematics, Artificial Intelligence, and
Figure 1. Macro and micro mapping process

Operations Research) with a wide range of application in the areas of modelling heterogeneous optimization and satisfaction problems. Moreover, the nature of CP provides other important advantages such as fast program development, economic program maintenance and efficient runtime performance. Problems are expressed in terms of three entities: variables, their corresponding domains, and constraints relating them.
The presented approach recognizes the synchronization problem as a scheduling problem, similar to some extend to the well-known Job Shop Scheduling Problem (JSSP). Roughly, this problem consists in allocating the proper resources to the list of jobs facing an optimization goal to minimize some temporal, productivity or efficiency cost function. By setting the analogy to the JSSP, the available cells as portions of the airspace can be considered as the existing resource and the aircraft as the jobs that are performed requiring the resource.
A. Tight trajectory interdependencies resolution
The mapping and filtering processes generate a representation of all the conflicts that must be removed by the optimization model. In a first CP model version, the tight trajectory resolution is modeled using one control action: Shifting the entire trajectory by a delay to be applied on the CTOT. As Figure 3 illustrates, the CTOT of aircraft 2 is shifted ahead of its original schedule and the CTOT of aircraft 3 is delayed to guarantee that all three aircraft arrive to the cells in conflict at different time windows.
Let � be the set of aircraft, � the set of cells belonging to
one collective microregion and �* =< �, � > the pairing
between the aircraft � using a given cell � at the microregions.
The pairings �* ∈ �? are defined as:
�? = < �, � > |∀� ∈ �, ∀� ∈ �
Finally, the time occupancy of the cell � by aircraft � is defined
by the two parameters:
�*B+ ≡ ���������
( 1) �*B, ≡ ��������
1) Decision variables To ensure that the departure adjustment of the aircraft remain
in the defined timeframe of [-5,10] minutes, the integer decision
variable �* is defined as the delay applied to the CTOT of
aircraft �:
�* ∈ −�LMN, �L*O ,
where �LMN = 5and�L*O = 10 minutes, sets the domain for the delay decision variable.
The use of a cell by an aircraft is modeled by means of interval decision variables. Interval decision variables represent time periods whose duration and position in time are unknown in the optimization problem. The interval is characterized by a start value, an end value and a size. Addressing this concept as a scheduling problem, the interval is the time during which something happens (e.g. an activity is carried out). In this case,
it is the occupancy of the cell � by an aircraft � modeled by the interval decision variable:
�S* = �SU , �SU , ∀�* ∈ �? ( 2)
and the size:
�� �SU = �SU − �SU(= �*B, − �*
B+)
where �SU and �SU are the interval start and end time respectively.
Since the shifting applied to the trajectory to avoid the
proximate events is determined by the delay �* and no speed adjustments are accepted, the domain of the interval variable can be defined as (see also (1)):
�SU ∈ �*B+ − �LMN, �*
B, + �L*O , ∀�* ∈ �*
(3)
As illustrated in Figure 3, the time occupancy of the cell
that is involved in a concurrent event remains constant. The
aircraft takeoff time instants are shifted according to the delay
� that is applied to avoid the concurrent event in the cell.
Each of the cells can be occupied by one aircraft at a time,
so the aircraft going through the cell must be sequenced
accordingly. The decisions on the use of conflicting cells are
modeled by sequence variables, which are defined as:
�S = �SU �* ∈ �? , ∀� ∈ � (4)
with the permutation � of the sequence variable �S as the function
�: �S → [1,�]
where � = |�S| is the number of aircraft going through the cell
�. The elements of the sequence meet the following conditions:
�SU\ ≠ �SU^ ⇒ � �SU\ = � �SU^ , ∀�SU\ , �SU^ ∈ �S
Figure 2. Detection of collective microregions at macro and micro level
Figure 3. Resolution of tight trajectory interdependencies (C=Conflict)

2) Constraints Two constraints are identified in order to define the space of
feasible solutions. The first constraint aims to model the shifting of every interval variable according to the applied delay:
� �SU = �*B+ +�* , ∀�* ∈ �? ( 5)
where the function � · is defined as the interval start time
(aircraft entry to cell �):
� �SU = �SU ( 6)
The second constraint is the no overlap constraint that imposes a set of interval variables to not overlap each other in
time. In this case, all aircraft in a cell � with proximate events should have no overlap:
∀��� , ��� ∈ �S
( 7) �� �S ⟺ �(�S\) < �(�S^) ⇒ �(�S\) ≤ �(�S^)
where the function � · is defined as the interval end time
(aircraft exit from cell �):
� �SU = �SU ( 8)
and the no overlap is guaranteed for the proximate event �S\
at a position prior to any �S^ by constraining its exit time to be
lower or equal to the entry time of the subsequent proximate events �S^ .
3) Optimization goal The objective function was chosen to enhance adherence
with a synchronization mechanism, though flexible, does not preserve the TTA at destination airport. Therefore, it aims to minimize the differences between actual takeoff times and the planned or CTOTs.
The optimization goal of the solution is to minimize the total aircraft delays, and it is formulated as follows:
�*
N
*f/
(9)
where � refers to the aircraft and �* is the delay applied. The whole optimization model is listed here:
� set of aircraft
� set of cells at a collective microregion
�? = < �, � > |∀� ∈ �, ∀� ∈ �
d.v. �* ∈ −�LMN, �L*O , ∀� ∈ �
d.v. �SU ∈ �*B+ − �LMN, �*
B, + �L*O , ∀�* ∈ �*
d.v. �S = �SU �* ∈ �? , ∀� ∈ �
minimize �*N*f/
subjectto{
� �SU = �*B+ +�* , ∀�* ∈ �?
∀��� , ��� ∈ �S
�� �S ⟺ �(�S\) < �(�S^) ⇒ �(�S\) ≤ �(�S^)
}
This model successfully solved an over-stressed realistic scenario. The scenario was composed of a set of 4010 real 4D trajectories in the European airspace for a time window of 2 hours, showing more than 65.000 proximate events. Nevertheless, the modified trajectories do not meet the TTA, since no speed adjustment possibility is included in this model. Next section extends the model in order to improve the RBT adherence of the modified trajectories.
B. Tight trajectory interdependencies resolution with speed
adjustments
TTA adherence is a main objective to enhance capacity at arrival airports. Clearly, the TTA cannot be preserved by shifting the CTOT and therefore, the full trajectory. The TTA in ATM has a small margin of [-1,1] minute. Therefore, its compliance is of high importance. To meet these conditions, the model described in section 3.1 has been extended by introducing the concept of segments for describing the full trajectory from departure (CTOT) until the arrival time to the destination (TTA). Figure 4 illustrates this concept. For instance, aircraft 1 in the figure is divided into five segments: C1 and C2 represent the concurrence events while S1, S2 and S3 are the segments between the concurrence events. In the modified trajectory, the segment S1' is shifted according to the applied delay on the CTOT to avoid the first concurrence event while S3' is shortened in time by speed change in order to preserve the TTA within the margin. The intermediate segment S2’ is extended in time by flying with reduced speed to avoid concurrence event C2.
The speed adjustments are realized under the condition that the segment between proximate events are of a certain minimum duration. That allows to introduce a speed change that is efficient in the sense of fuel consumption and in the effect on the resolution of the conflict while trying to preserve the TTA.
New data structures are included to model the trajectory
segments for speed adjustments. Let �M* be a segment of the
aircraft � trajectory. Therefore, the RBT can be noted as:
���* = �M* , � = 1. . �(�)
where �(·) is the number of segments required for describing the trajectory. For instance, the Figure 4 shows the trajectory
segments of aircraft 1, represented as ���* =
{�1, �1, �2, �2, �3} with
� �M* = starttimeof�M
* ,
e �M* = ����������M
*
Figure 4. Resolution of tight trajectory interdependencies with speed change
(C=Conflict; S=Segment; Sz=Size)
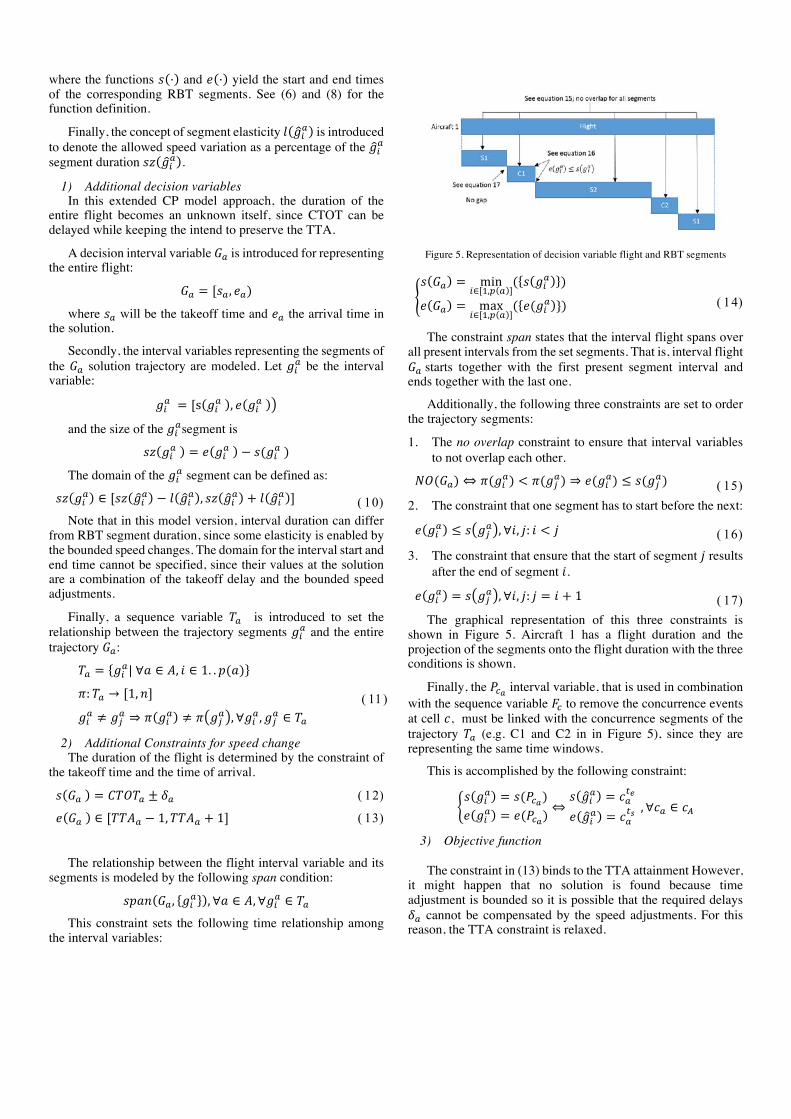
where the functions � · and � · yield the start and end times of the corresponding RBT segments. See (6) and (8) for the function definition.
Finally, the concept of segment elasticity � �M* is introduced
to denote the allowed speed variation as a percentage of the �M*
segment duration �� �M* .
1) Additional decision variables In this extended CP model approach, the duration of the
entire flight becomes an unknown itself, since CTOT can be delayed while keeping the intend to preserve the TTA.
A decision interval variable �* is introduced for representing the entire flight:
�* = [�* , �*)
where �* will be the takeoff time and �* the arrival time in the solution.
Secondly, the interval variables representing the segments of
the �* solution trajectory are modeled. Let �M* be the interval
variable:
�M* = [s �M
* , � �M*
and the size of the �M*segment is
�� �M* = � �M
* − �(�M*)
The domain of the �M* segment can be defined as:
�� �M* ∈ [�� �M
* − � �M* , �� �M
* + � �M* ] ( 10)
Note that in this model version, interval duration can differ from RBT segment duration, since some elasticity is enabled by the bounded speed changes. The domain for the interval start and end time cannot be specified, since their values at the solution are a combination of the takeoff delay and the bounded speed adjustments.
Finally, a sequence variable �* is introduced to set the
relationship between the trajectory segments �M* and the entire
trajectory �*:
�* = �M*|∀� ∈ �, � ∈ 1. . �(�)
( 11) �: �* → [1, �]
�M* ≠ ��
* ⇒ � �M* ≠ � ��
* , ∀�M* , ��
* ∈ �*
2) Additional Constraints for speed change The duration of the flight is determined by the constraint of
the takeoff time and the time of arrival.
� �* = ����* ± �* ( 12)
� �* ∈ [���* − 1, ���* + 1] ( 13)
The relationship between the flight interval variable and its segments is modeled by the following span condition:
���� �* , �M* , ∀� ∈ �, ∀�M
* ∈ �*
This constraint sets the following time relationship among the interval variables:
� �* = minM∈ /,� *
( � �M* )
� �* = maxM∈ /,� *
( �(�M* })
( 14)
The constraint span states that the interval flight spans over all present intervals from the set segments. That is, interval flight
�*starts together with the first present segment interval and ends together with the last one.
Additionally, the following three constraints are set to order the trajectory segments:
1. The no overlap constraint to ensure that interval variables
to not overlap each other.
��(�*) ⇔ �(�M*) < �(��
*) ⇒ �(�M*) ≤ �(��
*) ( 15)
2. The constraint that one segment has to start before the next:
� �M* ≤ � ��
* , ∀�, �: � < � ( 16)
3. The constraint that ensure that the start of segment � results
after the end of segment �.
� �M* = � ��
* , ∀�, �: � = � + 1 ( 17)
The graphical representation of this three constraints is shown in Figure 5. Aircraft 1 has a flight duration and the projection of the segments onto the flight duration with the three conditions is shown.
Finally, the �SU interval variable, that is used in combination
with the sequence variable �S to remove the concurrence events
at cell �, must be linked with the concurrence segments of the
trajectory �* (e.g. C1 and C2 in in Figure 5), since they are representing the same time windows.
This is accomplished by the following constraint:
� �M* = �(�SU)
� �M* = �(�SU)
⇔� �M
* = �*B�
� �M* = �*
B� , ∀�* ∈ �?
3) Objective function
The constraint in (13) binds to the TTA attainment However,
it might happen that no solution is found because time adjustment is bounded so it is possible that the required delays
�* cannot be compensated by the speed adjustments. For this reason, the TTA constraint is relaxed.
Figure 5. Representation of decision variable flight and RBT segments

The following logical function is added:
� �* =1, � �* ∉ [���* − 1, ���* + 1]
0, otherwise
With this function, the number of TTA violations can be counted for introducing its minimization as an objective that can be combined with the objective function stated in (9) to minimize the total delay of the aircraft takeoffs. The following equation weights both objectives to get the optimization goal:
min�/ �*
N
*f/
+ �0 � �*
N
*f/
( 18)
The extended optimization model is listed here:
� set of aircraft
� set of cells at a collective microregion
�? = < �, � > |∀� ∈ �, ∀� ∈ �
���* = �M*|∀� ∈ �, � = 1. . �(�)
d.v. �* ∈ −�LMN, �L*O , ∀� ∈ �
d.v. �SU ∈ �*B+ − �LMN, �*
B, + �L*O , ∀�* ∈ �*
d.v. �S = �SU �* ∈ �? , ∀� ∈ �
d.v. �* , ∀� ∈ �
d.v. �M* , ∀� ∈ �, ∀� ∈ 1. . � � :
�� �M* ∈ [�� �M
* − � �M* , �� �M
* +
� �M* ]
d.v. �* = �M* , ∀� ∈ �
minimize
�/ �*N*f/ + �0 � �*
N*f/
subjectto{
s �M* = ����* ± �*∀� ∈ �
∀��� , ��� ∈ �S
�� �S ⟺ �(�S\) < �(�S^) ⇒ �(�S\) ≤ �(�S^)
���� �* , �M* , ∀� ∈ �, ∀�M
* ∈ �*
∀� ∈ �,∀�, � ∈ 1. . � �
��(�*) ⇔ �(�M*) < �(��
*) ⇒ �(�M*) ≤
�(��*)
� �M* ≤ � ��
* ∶ � ≤ �
� �M* = � ��
* ∶ � = � + 1
� �M
* = �(�SU)
� �M* = �(�SU)
⇔, �\
U fSU��
+ �\U fSU
�� , ∀�* ∈ �?
}
IV. DEALING WITH UNCERTAINTY
Considering the ATM sources of uncertainty (parameters of aircraft models in trajectory prediction, weather, failure of ATC systems, cancellation of flights, etc.) and the degree of safety required in PARTAKE, a rolling horizon model scope should be considered to handle reasonable amounts of uncertainty.
The flight management system (FMS) provides the primary navigation, flight planning, optimized route determination and enroute guidance for the aircraft. The guidance function of the FMS ensures that a flight within TBO concept will flight its RBT. But some deviations may occur both in time and space as a consequence of the mentioned causes. The time uncertainty is
defined as the inability to exactly determine in which instant of time an aircraft will overfly a certain fixed spot in the space.
The space uncertainty, which would be defined in the same way, shall not be taken into account since with the space discretization (mapping) done by the conflict detection, is considered to be solved: PARTAKE considers the effects on potential conflicts due to lateral deviations from RBT to be absorbed by the size of the cells (6 NM). That is, any deviation bellow 1 mile will result in the same conflicts detected at the mapping process.
However, time differences between the enroute flights with respect to their corresponding RBT can be detected when the CTOT of the flights ready to depart is to be calculated. These differences may affect the time window occupancy of the cells in conflict as defined in (1), so that the action to be taken for mitigating the potential conflicts can be affected too.
More formally, let be γ(t) ∈ ℝ� the RBT and γ(t) ∈ ℝ� the actual flown trajectory. Then, under the TBO concept we will
expect that γ t − γ t 0 ≈ 0 at least in most cases. The actual state of airborne flights is conducted every 5 minutes. When an
along-track deviation is detected, ρ is defined as the time difference existent between the actual position and the
predefined position in the RBT. That is, if γ t − γ t 0 ≠ 0
is observed, then ρ ∈ ℝ will be defined satisfying:
� � − � � + � 0 = 0 ( 19)
This work focuses on those deviations that may occur in time as a consequence of the effect of the wind. Two possibilities are
under consideration when a ρ is detected:
1. The FMS guidance functionality has not yet acted
because � is less than the alert value set on it.
2. The FMS is correcting � changing some aircraft flight
parameters.
Therefore, ρ is defined as a time function � � that describes the time diversion between the RBT and the actual flown trajectory as a function of time. As shown in Figure 6, it is
assumed that �(�) at the begining will increase depending on the wind until the maximum diversion allowed by the FMS is
reached. Then the FMS corrections will force �(�) to decrease
until the condition � � − � � 0 ≈ 0 is reached again. When
a ��is observed, the most conservative period �* , �� is selected for considering the duration of the time diversion.
Figure 6. Evolution of �(�) while FMS corrects the time diversion

A. Estimation of the time uncertainty
Four dimensional navigation is based on reaching a three dimensional waypoint at a required time of arrival by changing the aircraft flight profile. In this context several variables and parameters are involved in the concept of changing a flight profile. According to [10], airspeed is considered as the most important control variable in order to achieve a waypoint at a given time of arrival. The time that an aircraft spends moving
from an initial point �/ = (���, ���) to a final point �0 =(���, ���) can be represented as follows:
� =1
�
��
�*(�)
O0
O/
( 20)
where�* is the true airspeed of the aircraft at a given altitude, �
is the altitude and � is a conversion factor from knots to
feet/seconds. The along-track wind effect has to be taken into account for time computation. The wind produces an important change of the airspeed of the aircraft and this could affect the estimation of the time of arrival. The effect of the along-track wind over the aircraft airspeed in cruise level is associated with two elements [10][17]:
1. The direction of the wind with respect to the aircraft.
Depending of the relationship between the heading of
the along-track wind and the aircraft, it is called
tailwind or headwind.
2. The magnitude of the along-track wind which
represents the constant velocity of the wind at a given
altitude (cruise altitude). The along-track component of wind in the horizontal plane
can be represented as follows (equation parameters are defined in Table 1):
� � = �� � · ��� � � − ��(�) ± � ( 21)
By combining ( 20) and ( 21), the resultant equation used to compute the time of an aircraft flight between an initial point and a final point with constant velocity, is as follows:
� =1
�
��
�* � + �� � · ��� � � − ��(�) ± �
O6
O5
( 22)
By integrating ( 22), the result is the time estimation equation with wind effect:
� =1
�
[�0 − �/]
�* � ± �� � · ��� � � − ��(�) ± �
( 23)
TABLE 1 PARAMETERS FOR ESTIMATING WIND EFFECTS
Constant Details
�� Speed of the wind at a given altitude
�� Heading of the wind at a given altitude
� Factor to correct the magnetic north to true north
� Bearing of the aircraft’s track
Equation ( 23) can be used to estimate the minimum time in which an aircraft can fly from the initial point to the final point at true airspeed. Therefore, the time to the next collective micro-region of the delayed flight can be estimated from its current
observed position and true airspeed, determining whether the time diversion is affecting the future concurrence events or not. Furthermore, using ( 23), the available weather data and taking into account factors such as aircraft particular characteristics and the maximum operational values allowed by the FMS system a
model for �(�) can be postulated [1][15].
When the following condition holds:
� � − � � 0 ≠ 0, � ∈ [�* , ��] ( 24)
For every occupancy time window overlaping the period �* , �� , the new entry time to the micro-region can be recalculated from
the estimated � �+ as illustrated in Figure 7. The following modification is introduced in the CP model replacing (1):
�*B+ + � �+ ≡ ���������
( 25) �*B, + � �+ ≡ ��������
V. RESULTS
The model was applied to an over-stressed realistic scenario. The scenario was composed of a set of 4010 real 4D trajectories in the European airspace for a time window of 2 hours. In these experiments, we assumed RBT without uncertainties. In this context, the trajectories were discretized at each second, and each position was specified in terms of geographic coordinates and a time stamp. This scenario was designed and analyzed in the STREAM project [16], a EUROCONTROL SESAR WP-E project. The CP model has been implemented with the ILOG Optimization Suite [6] and the following results were obtained.
A. Macro and Micro Mapping The detection of the concurrence events in this paper is based
on the algorithms and results presented at [12][13] and [14]. The mapping process of the aforementioned scenario is described in these works, leading to the detection of the collective micro-regions that have been used in this work to find the optimal adjustments on CTOT and speed changes to reduce proximate events and, therefore, ATC interventions.
In Figure 8 (a) the enroute traffic through the collective micro-regions is shown. The Gantt diagram represents the time frame occupancy of the cells by each aircraft with the potential concurrence events detected from the RBT trajectories. Enroute trajectories are conflict free at the given time instant.
Figure 7. Effects of time diversion on conflict window

The Figure 8 (b) shows the situation found when grounded aircrafts depart according to their RBT CTOT. As it can be seen at the red framed cells (e.g. 12449 or 12450), concurrence events will appear between several aircrafts if they depart according to their CTOT. In this case, aircraft regulations could be issued by ATM or, later on, ATC interventions would be needed to remove the proximate events caused by the inserted traffic.
B. Trajectory adjustments The proposed CP model is used to determine the proper
adjustments on the CTOT and aircraft trajectories to remove the potential concurrence events.
As Figure 9 illustrates, all the potential concurrence events are removed by applying a combination of bounded delays on CTOT and/or speed adjustments, leading to a conflict free scenario. The bounded adjustments impose the actual takeoff time to be within the [-5,10] minutes of the aircraft CTOT as shown in (12) and the speed adjustments to be less than 10% of the RBT proposed by the airline (10). The ILOG CP solver was limited to 180 seconds to get the best suboptimal solution. All
the experiments were performed on a Window 10 computer with an Intel Core I7 CPU 2,30 GHz and 16GB RAM.
C. Solution analysis
Since the adjustments on CTOT and speed changes are bounded, the TTA fulfilment cannot be ensured. As stated in (18), the TTA requirement was relaxed, and its fulfilment was
included in the optimization goal. The used weights were �/ =10% and �0 = 90%, so giving priority to the TTA preservation.
The Figure 10 shows the correlation between the actual time of arrival (ATA) compared to the TTA with respect to the applied CTOT delay. As it can be observed, in most of the cases the bounded speed adjustments are not enough to recover the effect of the applied delays. In Figure 11 the absolute numbers of aircraft not able to meet their TTA with respect to the applied delay is shown. There are two main reasons explaining this results.
The first observation is that most of the aircraft are moved ahead of their CTOT. This is a consequence of the solver search strategy [19], since time to get the suboptimal solution was
limited to 180 seconds. This strategy is the default one and first takes the smallest values in the decision variable domains. In this
case, this value is −5 minutes for the �* delay. Further research is required to define search strategies leading to better solutions.
The second reason can be explained from the curves at Figure 12. The number of aircraft not meeting their TTA is
(a)
(b)
Figure 8. Gantt diagrams showing the traffic through the cells with potential
concurrence events. Diagram (a) shows the conflict free en-route traffic and (b)
shows the emerging conflict after inserting the departing traffic for the same
time period
Figure 9. The diagram shows the conflict free solution after applying small
adjustments on CTOT and speed.
Figure 10. Correlation between TTA violation and the delays applied to the
aircraft takeoff times.
Figure 11. A/C not meeting their TTA with respect to the applied CTOT
delay.

tightly related to the applied delay, as it can be observed from dotted curves. However, the average modification on flight duration is not related to the applied delay. The margins enabled by the bounded speed adjustments are not enough for compensating the applied delays. This fact could be overcome only if, first, solutions with lower absolute delays can be found (better search strategy) and, second, if the aircraft trajectory allows a bigger absolute elasticity. The latest does not depend on the solution method, but on the duration of the flight and on the number and relative position of the proximate events where it is involved.
VI. CONCLUSIONS
In this work a CP model is presented for solving the concurrence events that might happen when the departure traffic is inserted into the enroute traffic. The model has been proved in a realistic and overstressed scenario and it has been able to find suboptimal solutions in a timeframe of 180 seconds for all the performed experiments. The model constraints ensure that all the proximate events are resolved by introducing small time adjustment both on the CTOT and relevant TTO’s while maximizing the adherence to the RBT’s. Although the model is not able to ensure that the ATM concept of preserving the TTA in a strict time frame is met, the CP solver can find solutions that remove all the conflicts reducing the number of potential ATC interventions. The concept of preserving the TTA has been relaxed and the objective function penalizes the TTA violation. The reason for this is the limit of the trajectory elasticity, since speed adjustments are bounded to a percentage of the total RBT duration. Furthermore, the quality of the solution found so far is directly linked to the solver search strategy. In this work, default parameters for searching have been used, leading to a solution where the smallest domain values at the delay variable are tested first. The search starts with -5 minutes of adjustment on the CTOT and, due to time restriction for finding a solution, possible better solutions cannot be explored by the solver. In consequence, the obtained total delay requires extra effort for recovering the TTA and, since the trajectory elasticity is limited,
no acceptable speed change can be found to meet the TTA. Further research is required to define search strategies favoring the selection of adjustments close to zero in first term. This way speed adjustment efforts are expected to be smaller.
A modeling approach for dealing with uncertainty in RBT time stamps has been also proposed. Currently, the model is under validation by using RBT and radar data obtained from DDR2 [4].
ACKNOWLEDGMENT
This research is supported by the European Union’ s Horizon 2020 research and innovation program. The Project related to this research is PARTAKE “Cooperative departures for a competitive ATM network service” with Grant Agreement No. 699307. Opinions expressed in this paper reflect author’s views only.
REFERENCES
[1] Amaro, M., Rudinskas, D., Barrado, C. 2015. Design of a flight
management system to support four-dimensional trajectories. "Aviation", vol. 19, núm. 1, p. 58-65
[2] Javier Crespo, Cristina Cuerno, Rosa M. Arnaldo, Francisco J. Saez,
Mario Sadornil, Javier Pérez and Rocio Barragán. 2014. A Comparison of the two Arrival Traffic Synchronization Concepts Envisioned for Nextgen
and Sesar. 29th Congress of International Council of the Aeronautical Sciences. St. Petesburg. Russia. September 7-12, 2014.
[3] EUROCONTROL. 2016. “Flight Planning.” Available from:
http://www.eurocontrol.int/articles/flight-planning. [accessed 15th June 2016]
[4] EUROCONTROL, “DDR - Strategic traffic forecast,” [Online]. Available: https://www.eurocontrol.int/articles/ddr-strategic-traffic-
forecast. [Accessed 1 11 2016].
[5] P. Flener, J.Pearson, M. Agren, C. Garcia Avello, M. C¸ Çeliktin, and S. Dissing. 2007. “Air-traffic complexity resolution in multi-sector planning
using constraint programming.” Proceedings of ATM’07, the 7th USA/Europe R&D Seminar on Air Traffic Management. Barcelona,
Spain
[6] IBM. 2015. IBM ILOG CPLEX Optimization Studio OPL Language User’s Manual.
[7] Johnson, Sally C and Barmore, Bryan E. 2016. NextGen Far-Term
Concept Exploration for Integrated Gate-to-Gate Trajectory-Based Operations. 2016 AIAA Aviation Technology, Integration, and
Operations Conference; 16th ; 13-17 Jun. 2016; Washington, DC; United States.
[8] P. van Leeuwen, H.H. Hesselink and J.H.T. Rohling. 2002. Scheduling
aircraft using constraint satisfaction. National Aerospace Laboratory NLR. The Netherlands. Available from:
http://reports.nlr.nl/xmlui/bitstream/handle/10921/691/TP-2002-299.pdf?sequence=1. [Accessed 1 11 2016].
[9] Marriot, Kimbal and Stuckey, Peter. 1998. “Programming with
Constraints”. The MIT press.
[10] Mohleji, S. C. 1989. Optimal flight management system utilization with
ATC automation, IEEE Aeropostale and Electronic Systems Magazine 4(2): 26–32.
[11] Nicolas Barnier, Cyril Allignol. Trajectory deconfliction with constraint
programming. Knowledge Engineering Review, Cambridge University Press (CUP), 2012, 27 (3), pp 291-307.
<10.1017/S0269888912000227>.<hal-00935206>
[12] Nosedal, Jenaro, Miquel A. Piera, Sergio Ruiz, and Alvaro Nosedal. 2014. “An Efficient Algorithm for Smoothing Airspace Congestion by Fine-
Tuning Take-off Times.” Transportation Research Part C: Emerging Technologies 44. Elsevier Ltd: 171–84. doi:10.1016/j.trc.2014.03.017.
[13] Nosedal, Jenaro, Miquel A. Piera, Adriano O. Solis, and Carles Ferrer.
2015. “An Optimization Model to Fit Airspace Demand Considering a Spatio-Temporal Analysis of Airspace Capacity.” Transportation
Figure 12. The blue line represents the average modification of flight duration with
respect to the applied delay; dotted lines represent the number of A/C with the respective delay and the number of A/C not meeting their TTA.
Research Part C: Emerging Technologies 61. Elsevier Ltd: 11–28.
doi:10.1016/j.trc.2015.10.011.
[14] Nosedal, Jenaro. 2016. "Aircraft departure synchronization to reduce
ATC en route interventions" Available from: http://www.tdx.cat/bitstream/handle/10803/384849/jns1de1.pdf?sequenc
e=1 [accessed on 25th June 2016]
[15] Nuic, A. Poles, D. and Mouillet V., “BADA: An Advanced Aircraft Performance Model for Present and Future ATM Systems,” Int. J. Adapt.
Control Signal Process., vol. 24, no. 10, pp. 850–866, 2010.
[16] Ranieri, Andrea, Rubén Martinez, Miquel Angel Piera, Javier Lopez, and Miguel Vilaplana. 2011. “STREAM – Strategic Trajectory de-Confliction
to Enable Seamless Aircraft Conflict Management Concept , Methodology and Tools.” Sesarinnovationdays.eu, no. December: 1–8.
[17] Tom G. Reynolds, Yan Glina, Seth Troxel and Michael McPartland. 2012.
Establishing Wind Information Needs for Four Dimensional Trajectory-Based Operations. 1st International Conference on Interdisciplinary
Science for Innovative Air Traffic Management (ISIATM 2012)
[18] SESAR JU. 2015. " THE ROADMAP FOR DELIVERING HIGH PERFORMING AVIATION FOR EUROPE European ATM Master
Plan" Edition 2015. Available from: http://ec.europa.eu/transport/modes/air/sesar/doc/eu-atm-master-plan-
2015.pdf [accessed 20th June 2016]
[19] Van Beek, Peter. 2006. “Chapter 4 Backtracking Search Algorithms.” In Handbook of Constraint Programming, 2:85–134. Elsevier B.V.
doi:10.1016/S1574-6526(06)80008-8.
VII. AUTHOR BIBLIOGRAPHY
Dr. Juan J. Ramos is a researcher focusing on modelling, simulation and optimization of dynamic systems, especially in the field of logistics. He received his Ph.D. from the Universitat Autonoma de Barcelona (UAB), Spain in 2003, where he is professor at the Dep. of Telecommunication and System
Engineering. He is currently the program Director of the European Master on Logistics and Supply Chain Management
at UAB.He is a member of LogiSim, a recognized research group on Modeling and Simulation of Complex Systems. Furthermore, he is expert in production technologies/logistics, intelligent transport systems, information and communication technology, industrial collaboration and technology transfer. He is co-founder of Aslogic.
Pau Folch received his bachelor degree in pure mathematics from the Universitat Autonoma de Barcelona (UAB), Spain in 2016. He is employee at Aslogic, working in machine learning and deep learning techniques in the ATM context. Currently, his is doing a master degree in Modelling for Science and Engineering from the (UAB).
Nina Rebecca Schefers received her bachelor degree in international information management from the Universität Hildesheim, Germany in 2013 and her master degree in Logistics and Supply Chain Management from the Universitat Autonoma de Barcelona (UAB), Spain in 2015. Currently, she is a Ph.D candidate at UAB with research work related to aeronautics and logistics. Her research subject is related to decision making and optimization of processes in Logistics, Manufacturing and Transportation.
Marko Radanovic is a PhD candidate within the Department of Telecommunications and Systems Engineering at Universitat Autònoma de Barcelona. He graduated from the University of Belgrade in Air Transport and Traffic Engineering (2007), and obtained master degree in Satellite Navigation from Politecnico di Torino (2012). His research lines are Automation in Air Traffic Management, Modelling and Simulation of Aeronautical Systems and Air Traffic Safety.
Dr. Miquel Angel Piera Eroles is full time professor in the Telecommunication and System Engineering department at Universitat Autònoma de Barcelona. Miquel graduated with excellence from UAB in Computer Engineering (1988), MSc from University of Manchester Institute of Science and Technology in Control Engineering (1991), and PhD from UAB in 1993. Dr. Piera is UAB delegate for Technical Innovation Cluster, former deputy director of the UAB Engineering School and director of LogiSim (research group on Modelling and Simulation of Complex Systems). At present Dr. Piera is active in the innovation sector, contributing as scientific advisor to the company Aslogic.

Paper 3
76

Paper 3
77
Chapter 8
8. Paper 4
The paper “A Constraint Programming Model with Time Uncertainty for Cooperative Flight Departures” which has been accepted by the journal Transportation Research Part C shows the complete detection,
filtering and mitigation methodology. In comparison to paper 2, the detection and filtering methodology
has been further improved by smoothing the process to obtain a powerful detection mechanism.
Furthermore, the mitigation model has been improved by introducing different flight levels to the model
and speed changes and by considering time uncertainty. The work shows a model that explains how to deal
with the trajectory prediction under time uncertainty in the RBT and shows its results on a realistic traffic
scenario obtained from obtained from Eurocontrol Demand Data Repository (DDR2). The research goal of
this paper is to present a new CP mechanism to reduce the probability of separation minima infringement
at the tactical level while preserving ATFM planned operations, taking into consideration time uncertainties
and different flight levels. CP has been used to develop a constrained version of the ATM problem, allowing
to separate the model formulation from the data and from the search strategy. The novelty of this efficient
departure synchronization methodology that serves as a mitigation mechanism for concurrence events is
that it considers the downstream effects of the applied measures while considering small departure
adjustments, multi-flight levels, speed changes and time uncertainty.

1
A Constraint Programming Model with Time
Uncertainty for Cooperative Flight Departures
Nina Schefers (1), Juan José Ramos González (2), Pau Folch (3) , José Luis Munoz-Gamarra(4)
(1)(2) Technical Innovation Cluster on Aeronautical Management, Universitat Autonoma de Barcelona, Sabadell (Barcelona), Spain.
(e-mail: [email protected]), (e-mail: [email protected]). (3)(4)
Department of Research and Innovation, Aslogic, Rubí, Spain
(e-mail: [email protected]), (e-mail: [email protected]).
Abstract— The lack of a proper integration of strategic Air Traffic Management decision support tools with tactical Air Traffic
Control interventions usually generates a negative impact on the Reference Business Trajectory adherence, and in consequence affects
the potential of the Trajectory-Based Operations framework. In this paper, a new mechanism relaying on Reference Business
Trajectories as a source of data to reduce the amount of Air Traffic Controller interventions at the tactical level while preserving Air
Traffic Flow Management planned operations is presented. Artificial Intelligence can enable Constraint Programming as it is a powerful
paradigm for solving complex, combinatorial search problems. The proposed methodology takes advantage of Constraint Programming
and fosters adherence of Airspace User’s trajectory preferences by identifying tight interdependencies between trajectories and
introducing a new mechanism to improve the aircraft separation at concurrence events considering time uncertainty. The underlying
philosophy is to capitalize present degrees of freedom between layered Air Traffic Management planning tools, when sequencing
departures at the airports by considering the benefits of small time stamp changes in the assigned Calculated Take-Off Time departures
and to enhance Trajectory-Based Operations concepts.
Keywords— Air Traffic Management; Trajectory Based Operations; Decision Support Tool; Constraint Programming; Trajectory
Prediction; Uncertainties; Predictive Analysis; Conflict Detection and Resolution; Artificial Intelligence, Data Analysis; Air
Transportation Planning; System-level Simulation; Reference Business Trajectories;
1. INTRODUCTION
ir transport is an integral part of transport infrastructure and a significant sector of the economy, predicted with steady growth in the next
decades. The growth will put pressure on the infrastructure that is already struggling to cope with the demand (IATA, 2017) and reduce the
robustness to external conditions such as weather. Therefore, the identification and improvement of operational and managing policies for
better performance of the existing airspace procedures is essential for the air traffic industry. To tackle this challenge, the initiatives Next
Generation Air Transportation System (NextGen) in America and the Single European Sky ATM Research (SESAR) in Europe were established.
In Europe, the Air Traffic Management (ATM) Master Plan was introduced to summarize essential operational and technological changes to
deliver the essential contributions for the Single European Sky performance objectives (Sesar, 2015). To enable maximum performance gains,
researchers investigate a variety of research fields such as: Separation Management, Data Science in ATM, Information Management in ATM,
ATM Performance and Trajectory-based Operations (TBO). Under the framework of the TBO concept, the intention of this innovative approach
is to design a competitive ATM system supporting up to a certain extent the Airspace User (AU) demands at the right time (i.e. departure slots),
at the right cost (i.e. suitable level of Air Traffic Control (ATC) service) at the right place (i.e. AU’s preferred trajectories) and at the right service
quality (i.e. safety) without extra investments, just by removing the ATM non-added-value operations that indirectly impact on the present ATM
capacity.
By empowering the concept of TBO as a flexible synchronization mechanism towards an efficient and competitive ATM service a precise
description of an aircraft trajectory in space and time can be retrieved that consist of only small uncertainties, as stated in the EUROCONTROL
ATM Lexicon (Eurocontrol, 2017c). Under the TBO approach, AU should fly precise 4-dimensional trajectories (4DTs), previously agreed upon
with the Network Manager. Reference Business Trajectories (RBT) provide an excellent source of information to identify future situations in
which two or more aircraft could require ATC directives to maintain the required separation minima. The presented approach aims to improve
the present demand and capacity balance in ATM by introducing small ground delays in the programmed departure that will not affect the planned
traffic since the slot time window assigned to each aircraft will be preserved. Furthermore, this integrated approach proposes mitigation methods
that can consider the preferences of Airlines and Airports. The major challenge in this work is to reduce the probability of ATC tactical
interventions. Therefore, the research goal of this paper is to present a new Constraint Programming mechanism to reduce the amount of ATC
interventions at the tactical level while preserving Air Traffic Flow Management (ATFM) planned operations taking into consideration time
uncertainties and different flight levels.
The paper is innovative in the sense it proposes an integrated approach combining potential conflict detection, and a mitigation mechanism
considering trajectory prediction under time uncertainty. The work presents a set of tools to determine small Calculated Take-Off Time (CTOT)
adjustments within the [−5, ] minute interval along with bounded modifications on the flight duration as control actions. These actions will be
calculated to mitigate the potential tight trajectory interdependencies on a multi-flight level that can emerge after inserting the traffic ready to
depart.
To address the complex air transportation planning problem, the use of Constraint Programming (CP) by ILOG (Marriott and Stuckey, 1998;
Van Beek, 2006; IBM, 2015) is proposed to calculate those feasible departure configurations. To develop machines that can perform higher order
cognitive tasks, Artificial Intelligence techniques can enable CP as it is an emergent software technology for declarative description and effective
A

2
solving of large, particularly combinatorial, problems especially involving scheduling, resource allocation, placement and planning. Finally, a
novel approach that considers the time uncertainties for mitigating tight trajectories is presented. The results of the paper demonstrate how the
time uncertainties are respected during the conflict mitigation phase based on CP. The modules are tested on a realistic traffic scenario.
A holistic view of the main concept is illustrated in Figure 1. The figure shows potential concurrence events, representing a potential conflict,
that are detected by analysing the spatiotemporal interdependencies between flights sharing the same airspace. To mitigate the concurrence
events, the trajectories are shifted using slight CTOT modifications and bounded speed adjustments in such a way that a clearance is achieved.
Figure 1: Overview of the proposed concept
The paper is organized as follows: Section II describes the current state of the art. Section III briefly introduces the mapping and filtering
mechanism implemented to detect the trajectory interdependencies between airborne flights and the new traffic; Section IV describes the CP
model proposed to mitigate the detected concurrence events that would require ATC interventions; Section V proposes a model to deal with the
trajectory prediction under time uncertainty in the RBT; Section VI discusses the experimental results achieved so far; finally, conclusions and
open questions for further research are discussed in Section VII.
2. STATE OF THE ART
The research sector of Conflict Detection and Resolution has undergone a paradigm shift from tactical to strategic ATC with the introduction
of the 4D-TBO concept, representing the current state of the art of this research sector. Instead of adjusting flights just in time, the overall flight
performance can be improved significantly by performing more efficient avoidance manoeuvres assuming proper forecasts (Kuenz, 2015). The
benefit of the TBO concept is an accurate 4-dimensional trajectory (3 spatial dimensions and time) the aircraft will fly. The details of the trajectory
will be shared by all involved parties through System Wide Information Management (SWIM). Also, intervention in the trajectory will happen
in full knowledge of the downstream effects as shown in (Nosedal et al., 2015) and hence it will be possible to pick the option causing the
minimum amount of trajectory distortion. Finally, the removal of most uncertainties around the trajectory, using Artificial Intelligence (AI) and
Data Analytics (DA) such as predictive analytics, makes it possible to improve the airspace volume as stated in (Wilco, 2017).
Researchers have used the advantages of the 4D-TBO concept and studied, among other, conflict detection and separation observance
approaches as in (Ruiz, Piera and Del Pozo, 2013; Ruiz et al., 2014) or strategic trajectory planning approaches with uncertainty as in
(Chaimatanan, Delahaye and Mongeau, 2018). Efficient High Performance Conflict Detection and Resolution methods have been developed in
(Kuenz, 2015) for large traffic scenarios based on an N-dimensional bisection of airspace allowing a significant reduction of complexity using
the TBO concept. An initial potential conflict detection approach based on the partitioning of the airspace has been proposed by (Nosedal et al.,
2014), which serves as the baseline for the present work. The work presented in this article introduces major contributions both in detection and
mitigation mechanisms with respect to the methods proposed in (Nosedal et al., 2014). As to detection mechanisms these contributions can be
summarized as follows: a 3D cell-grid based method is introduced for the 4D trajectory digitalization and an intelligent pairwise analysis is
implemented to avoid false negatives in the detection of the traffic through each neighbouring cell. The proposed 3D discretization enables the
representation of the trajectories from departure to arrival. From the methodological perspective, full 4D trajectories are processed and the analysis
is not limited to a particular phase of the flights; from the applicability perspective, the proposed technique extends its usability to TMA and not
just to en-route traffic; from the practicality perspective, the technical implementation of mapping and detection processes scales to different
operational contexts, with different criteria for vertical and lateral separation. Regarding the mitigation mechanisms, the model has been totally
reformulated while preserving the basic idea of the CTOT shifting to remove conflicts. In summary, the Constraint Programming (CP) model
presented in this paper has the following major improvements: the new decision variables represent the whole flight trajectory, which enables
the removal of its potential conflicts happening at different flight levels; introduces slight speed adjustments as decision variables in order to
minimize the impact of the CTOT shifting in the arrival time; the model can tackle the effect of along-track deviations, if they can be measured
or estimated; finally, the new CP formulation takes advantage from propagation mechanisms of constraints such as no overlap, span and
synchronize, with a very positive impact in the computational effort required to solve this combinatorial optimization problem.
Moreover, the trajectory optimization studies focusing on the sensitivity of operational costs and efficiency have been carried out in (Vilardaga
and Prats, 2015) and a coordinated multi-aircraft 4D trajectories planning, considering the buffer safety distance and fuel consumption
6NM
6N
M
Overlap at cell
Loss of separation minima
(Concurrence Event)
Clearance at cell
Maximize minimum clearance
S2’
S1 S2
Mitigation actions
Airspace discretization
TimeShiftingBounded Speed
Adjustment

3
optimization has been studied in (Qian et al., 2017). Finally, machine learning techniques have been used recently, for example to address the
short-term trajectory prediction problem in Terminal Manoeuvring Area (TMA) based on 4D trajectory prediction as in (Wang, Liang and
Delahaye, 2017).
The introduction of the 4D TBO concept, furthermore allows introducing further system-level policy decision making processes such as Short-
Term ATFCM Measures (STAM). STAM can involve measures like advancing or delaying aircraft by using the minor departure adjustments on
the ground (referred to as green delays in (Castelli, Pesenti and Ranieri, 2011; Piera et al., 2014)), fight level capping, minor re-routings e.g. in
(Adacher, Flamini and Romano, 2017), linear holding e.g. in (Xu and Prats, 2017), slot allocation and sequencing methods, e.g. in (Çinar and
Demirel, 2017; Liang, Delahaye and Maréchal, 2017; Marcella et al., 2017), headings or speed variations which apply to a limited number of
flights to reduce the complexity of the anticipated traffic peaks (Eurocontrol, 2017b). However, some manoeuvres are often not considered
desirable measures by AUs due to high operational and fuel consumption costs as it was evaluated in studies of (Ferguson et al., 2013; Envisa,
2017). Green delays on the ground are therefore a more acceptable alternative which is also the mitigation measure used in this work. The concept
considers the small departure time adjustments recognizing global trajectory interdependencies. The goal of STAM applications is to support the
dynamic Demand Capacity Balancing (DCB) concept and therefore, to improve Air Traffic Flow and Capacity Management to enhance the ATC
workload as proposed in (Masalonis, Callaham and Wanke, 2003; Netjasov, Janić and Tošić, 2011). Nowadays, the systems strongly rely on AI and DA. During the last years, supported by the introduction of the 4D-TBO concept, the
application and improvement of Decision Support Tools (DST) in ATM was advanced to support the global performance ambitions for air traffic
planning and optimization. From an operational research perspective, some ATM problems can be seen as decision-making problems whose
resolution consists of determining the domain values of the decision variables to reach feasible solutions. Furthermore, in case an objective
function is formulated to describe the benefits of each feasible solution, there are some methods that could be applied to identify the best solution.
However, since ATM problems (such as re-routing, flight-level changes, or ground-holding schemes) are usually complex problems of a large
dimension, and highly combinatorial, there are few AI problem-solving technologies that can cope with that many different degrees of freedom.
One efficient technique is CP, which has also been used in this work to determine which aircraft CTOT should be modified within the domain of
[-5,10] minutes. CP is a powerful paradigm for representing and solving a wide range of combinatorial problems (Rossi, Van Beek and Walsh,
2006) and offers a constrained version of real world data analysis problems (Rossi and Saraswat, 2006). In the last years, the paradigm has
attracted much attention among researchers because it proposes on the one hand the modelling, using a high-level programming language, and
on the other hand the solving, using various techniques from different areas such as mathematics, artificial intelligence, and operations research
(Van Hentenryck, Simonis and Dincbas, 1992). Moreover, the nature of CP provides other important advantages such as a fast program
development, an economic program maintenance and an efficient runtime performance.
Other than metaheuristic or heuristic method, such as evolutionary algorithms, CP is used to solve complex combinatorial Constraint
Satisfaction Problems (CSP). CSPs are expressed in terms of three entities: variables, their corresponding domains, and constraints relating them.
Constraints can be considered as the main characteristics of CP. They are treated as logical relations among several unknowns (or variables),
each taking a value from a set of accepted values called domain, which can be a range with lower and upper bounds or a discrete list of numbers.
Solving a CSP consists in assigning a value to each variable in such a way that every constraint is satisfied. The main interest of such a technology
is the generality in the notion of what is a constraint. It enables the user to have access to a rich, high-level language that helps combine constraints
together to build new ones, thus leading to an expression of the problem that is very close to its mathematical formalisation. The representation
of the problem, in terms of constraints, results in short and simple programs easily adaptable to future changing requirements (Bessiere, 2006).
The application of CP is used both in scientific and industrial sectors for many kinds of application, such as scheduling or resource assignment
problems. Furthermore, it has been successfully used in many research studies in the ATM field, as reported in (Allignol et al., 2012). A CP
model in the ATM context that would consider all degrees of freedom (3D geometry and time) to generate an optimal set of conflict-free 4D
trajectories at a continental scale is out of scope reach for the current combinatorial problem-solving technologies. In this work, the use of CP to
reduce the ATC interventions by profiting of time stamps (i.e. RBTs) as a degree of freedom is proposed. Furthermore, the degree of freedom is
constrained to a time window of -5 to +10 minutes of the assigned departure time and, in comparison to existing works, this approach considers
a fixed part which is determined by those aircraft that are already in the air and cannot be modified. Therefore, the large-scale space of solutions
is reduced to a size in which CP models could provide feasible and even quasi-optimal solutions.
Considering the ATM sources of uncertainty (parameters of aircraft models in trajectory prediction, weather, failure of ATC systems,
cancellation of flights, etc.) and the degree of safety, a rolling horizon model scope is recommended to be considered in CP models to handle
reasonable amounts of uncertainty. To avoid being affected by the scalability problems, the time windows should be considered small enough to
take into account only a limited amount of uncertainty. Based on the classification of uncertainty sources as described in (Mondoloni, 2006;
Casado, Goodchild and Vilaplana, 2012) in which many uncertainties can be modelled as stochastic variables, (Pabst et al., 2013) proposes a
method to transfer those stochastic errors to the position errors. In this work, a similar approach is presented, focusing on the weather forecast
uncertainties, particularly the impact of along-track wind uncertainty.
Existing literature shows that CP in ATM is used in rolling horizons in which the ‘past’ part of the current solution is fixed and the decision variables are considered as constants. The ‘future’ part of the problem is resolved with the new horizon. Various CP models to improve air traffic
services have been developed. For example, a CP model for flight-level allocation for a vertical separation was developed in (Barnier and Brisset,
2004) and a CP model that minimizes the number of required ATFCM regulations has been developed in (Kerlirzin et al., 2000). Models that
focus on improving the ATC workload have been developed in (Trandac, Baptiste and Duong, 2005) where a CP model for an airspace
sectorization is presented and in (Flener et al., 2007) a CP model to minimize and balance the traffic complexities of airspace of the adjacent
sectors is proposed. Finally, (Chemla et al., 1995) laid the foundation for CP modelling of the slot allocation problems. In (Allignol et al., 2012)
a better description of improvements to the slot allocation problems together with CP applications can be found. Further planning methods and
decision support tools can be found in (Barnier and Allignol, 2009) where a CP model for a conflict-free planning method is introduced and (Van
Leeuwen, Van and Houwert, 2003) where a CP model for decision support is presented to aid the controllers in planning the movements of flights
within an airport and its airspace.
The present work proposes an evolved and improved CP model based on the initial work of (Schefers et al., 2016) to solve the problem by
describing the trajectory as a sequence of the time intervals that represent the conflict-free segments and the concurrence events segments
introducing a multi-flight level approach. The scheduling consists in ensuring of the non-concurrent use of the areas that were in conflict. Since

4
the tools highly rely on an accuracy of the Trajectory Prediction (TP) to reduce the number of the en-route conflicts, the time uncertainty is
considered in the approach and to complement it different flight levels are considered.
3. 3D CONCURRENCE EVENT DETECTION METHODOLOGY
The conflict detection is composed of two processes: the mapping process and the spatiotemporal interdependency detection. The concurrence
event detection methodology is designed to detect concurrence events in different flight levels (FL). In comparison to existing concurrence event
detection models, our approach does not only identify pairwise conflicts but interdependencies between trajectories that lose their safety buffer.
The benefits of this methodology are the efficient way of identifying concurrence events in air, the possibility to understand the impact of the
trajectory interdependencies and to apply mitigation measures.
In the following, the three processes for the 3D concurrence event detection are described.
3.1 3D Mapping Process
To detect concurrence events, the European airspace covering the longitude of -20 to 30 degrees and latitudes of 0 to 80 degrees, is partitioned
into square cells of 6 NM representing the lateral separation minima en-route. The defined horizontal separation minimum based on radar and/or
ADS-B and/or MLAT system according to ICAO Doc 4444 (ICAO, 2016) is set to 5 NM. In this work, the horizontal separation is set to 6 NM
to take into account any lateral deviations with respect to the RBT below 1 NM. It is worth to mention that the cell size is a parameter that might
be changed depending on the operational context (e.g. in TMA the cell size can be set to 3NM). Taking advantage of the 4D-TBO concept that
is based on the integration of time into the 3D aircraft trajectory, 4D trajectories are project onto the grid. The benefit of working with 4D
trajectories is that this concept ensures that the aircraft can fly on a practically unrestricted, optimum trajectory for as long as possible in exchange
of the aircraft being obliged to meet very accurately any arrival time over a designated point (SKYbrary, 2017). As a result of the mapping
projection a 4D trajectory is partitioned in segments, one for each cell the trajectory occupies. All the generated segments are stored in a matrix
representing the grid, whose size depends on the cell size and vertical separation to be considered. The segments are stored as a sequence of two
or more 4D points containing latitude, longitude, time and flight level. The first point in the sequence is the entry point in the cell and the last is
the exit point. The concept of the airspace discretization and mapping process can be seen in Figure 2.
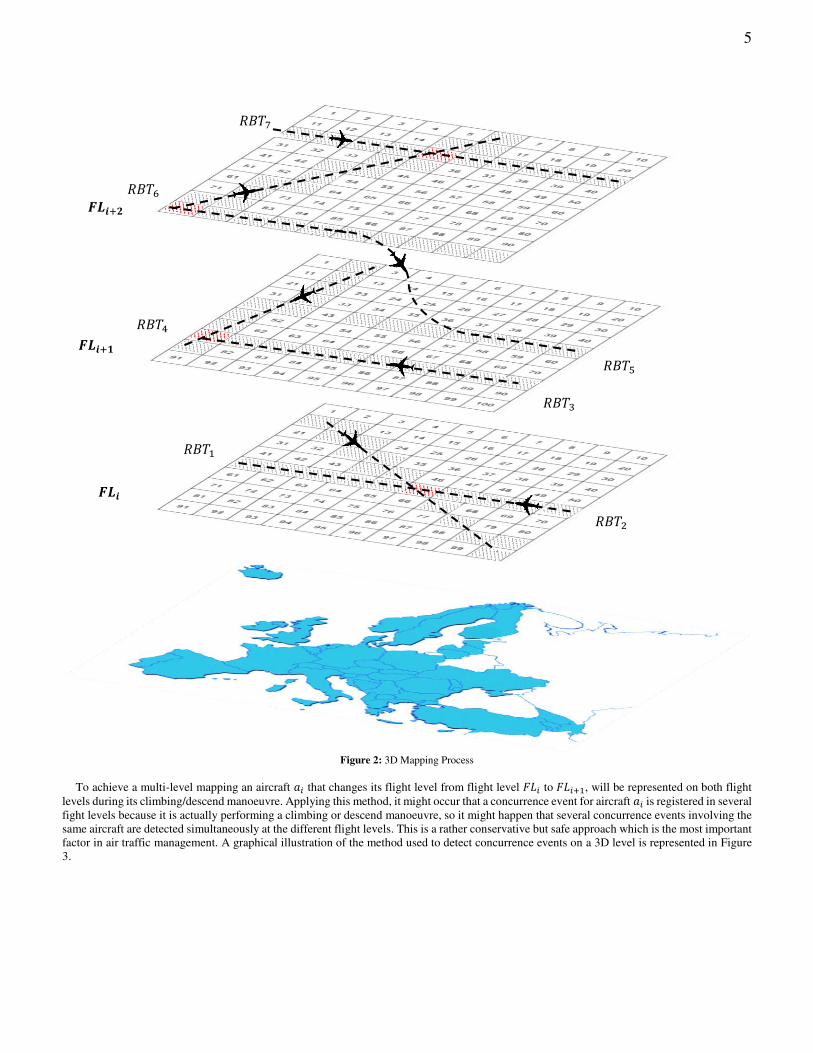
5
Figure 2: 3D Mapping Process
To achieve a multi-level mapping an aircraft that changes its flight level from flight level to + , will be represented on both flight
levels during its climbing/descend manoeuvre. Applying this method, it might occur that a concurrence event for aircraft is registered in several
fight levels because it is actually performing a climbing or descend manoeuvre, so it might happen that several concurrence events involving the
same aircraft are detected simultaneously at the different flight levels. This is a rather conservative but safe approach which is the most important
factor in air traffic management. A graphical illustration of the method used to detect concurrence events on a 3D level is represented in Figure
3.

6
Figure 3: 3D Multi-flight level mapping
3.2 Spatio-Temporal Interdependency detection
A concurrence event occurs when two or more aircraft loss the separation minima (vertical or horizontal). The presented approach solves the
existing concurrence events applying time shifts to some of the flights. However, this aircraft take-off times shifts can generate additional
concurrence events, which are called potential concurrence events. Hence for the mitigation phase the potential concurrence events, that are the
critical spatio-temporal interdependencies between pairs of aircraft, must be detected.
The detection of spatio-temporal interdependencies is performed by calculating the temporal looseness (“clearance time” or “overlap time”) between a pair of aircraft segments in the same cell (see Figure 4). The temporal looseness of two aircraft can be calculated by determining
the minimum value of the exit time of the two aircraft minus the maximum entry time. To be considered as a potential concurrence event the
temporal looseness of a pair must satisfy:
Where � is the maximum slot time shifting that can be applied (e.g. 10 min), and the maximum advanced time (e.g. -5 min), an refers to
the time of an aircraft entering into the cell and correspondingly, refers to the time of the aircraft leaving the cell . When there is
a clearance, and when > there is an overlap. For instance, if the domain for rescheduling the CTOT is set to [-5, 10] minutes, the greatest
value of to consider a pair of aircraft as a potential concurrence event is 15 minutes (900 seconds). Therefore, the list of the tighter spatio-
temporal interdependences must be filtered with ℎ = 5 minutes, the maximum CTOT shifting window which would not endanger the safety
separation even if the shift at each interval end is applied to each aircraft.
Figure 4: Spatio-temporal interdependency registration
It may happen that two or more aircraft are flying at two neighbouring cells losing the separation minima, so cell occupancy check will miss
those potential concurrence events. To ensure the reliability of the potential concurrence event identification, the traffic in the surrounding cells
of each cell is analysed using an intelligent neighbourhood check in order to properly detect any loss of separation. The algorithm takes for
each occupied cell all its surrounding cells that have at least one aircraft inside. Then the value is computed for all possible pairs of aircraft
that are in cell and in the neighbourhood, an all those pairs that have and > 9 are discarded. For the rest of the pairs, the minimum distance
between the segments is calculated and compared with the threshold value (6NM). The Figure 5 illustrates how this process will detect the loss
of separation between and in cell and cell 7. This verification is performed for each occupied cell in the grid.
A/C trajectory
Trajectory projection on
the upper level Trajectory projection on
the lower level
6NM
6N
M
Overlap at cell
Loss of separation minima
(Concurrence Event)
= ( , ) − ( , ) −ℎ = � − (1)

7
Figure 5: Neighbourhood analysis
The algorithm checks all the cells in the grid, and if the occupancy of the cell � is greater than zero then the temporal looseness is computed
for all the pairs of segments inside the cell �, as well as all the possible pairs that have one segment in the cell � and its neighbouring cells. For
those pairs that have one of the segments out of the cell � with H −hm, the algorithm also computes the minimum distance. Hence, the
computational effort of the algorithm depends on the grid size (number of cells) and, more relevant, on the distribution of the trajectory segments
in the grid, since the combinatorial part of the algorithm appears in the neighbourhood pairwise analysis when all the possible pairs are checked.
Nevertheless, computational times are very competitive when analysing realistic, or even stressed, traffic (few seconds in a standard desktop
computer as discussed later in this paper). This is because it doesn’t make sense to decrease the cell size arbitrarily and also because of the traffic
density in a given area is limited by the ATM capacity, so the pairwise analysis doesn’t create any combinatorial explosion. Furthermore, the
proposed algorithms can be easily parallelized in order to make neglectable the detection computational time in any practical application.
4. MITIGATION PROCESS
The conflict mitigation process is modelled as an optimization problem in Constraint Programming (CP) formalism (Marriott and Stuckey,
1998). The presented approach adopts CP as the solving technique for concurrence event mitigation recognizing the synchronization problem as
a scheduling problem, similar to some extent to the well-known Job Shop Scheduling Problem (JSSP) or for the Single Objective Optimization
Constrained Scheduling Problem (SOCSP) (Tselios, Savvas and Kechadi, 2013). Roughly, this problem consists in allocating the proper resources
to the list of jobs facing an optimization goal to minimize temporal, productivity or efficiency cost functions. Like the JSSP or the SOCSP, the
available cells, as portions of the airspace, can be considered as the existing resource and the aircraft as the jobs that are performed requiring the
resource.
The objective function of the problem is to reschedule the CTOT of an aircraft on the ground in such a way that en-route concurrence events
are minimized while the AU preferred RBT is preserved and the domain is respected. The domain of the here presented approach is the allowed
green delay time slot shifting of the CTOT of [-5,10] minutes. To reach this goal, the problem model considers concurrence events at different
flight levels, along-track deviations, bounded modifications on the flight duration to meet the Target Time of Arrival (TTA), and small departure
adjustments within the [-5,10] CTOT interval.
4.1 Tight trajectory interdependencies resolution
The output of the 3D concurrence event detection process includes a list of all concurrence events that have been detected during a specific
time within a specific airspace volume. This data serves as the input for the mitigation process. To remove all concurrence events the trajectory
resolution is modelled using two control actions: shifting the entire trajectory according to the slot time shifting that has been applied to the
CTOT, applying small speed adjustments meeting the TTA. Furthermore, the model considers the resolution of concurrence events at different
flight levels and considers time uncertainties to create a more realistic scenario. The parameters for the model are declared as follows.
Let be the set of aircraft, the set of Flight Levels (FL) and the set of cells with concurrence events and =< , , > the pairing
between the aircraft using a given cell at a given FL. The pairings are defined as: = {< , , > | ∀ , ∀ , ∀ }
the time occupancy of the cell by aircraft at a given FL is defined by the two parameters:
≡
≡
To meet the agreed TTA, the model also needs to consider small speed adjustments. Shifting the whole trajectory according to the applied slot
time shifting would not allow to meet the TTA. Therefore, data structures are introduced to model trajectory segments for speed adjustments.
The condition for applying speed adjustment is that the segments are of a certain minimum duration to allow the efficient resolution of the
conflicts and to ensure a reasonable operation of the aircraft in terms of fuel consumption.
1
2
1 2
3
4
5 6
7
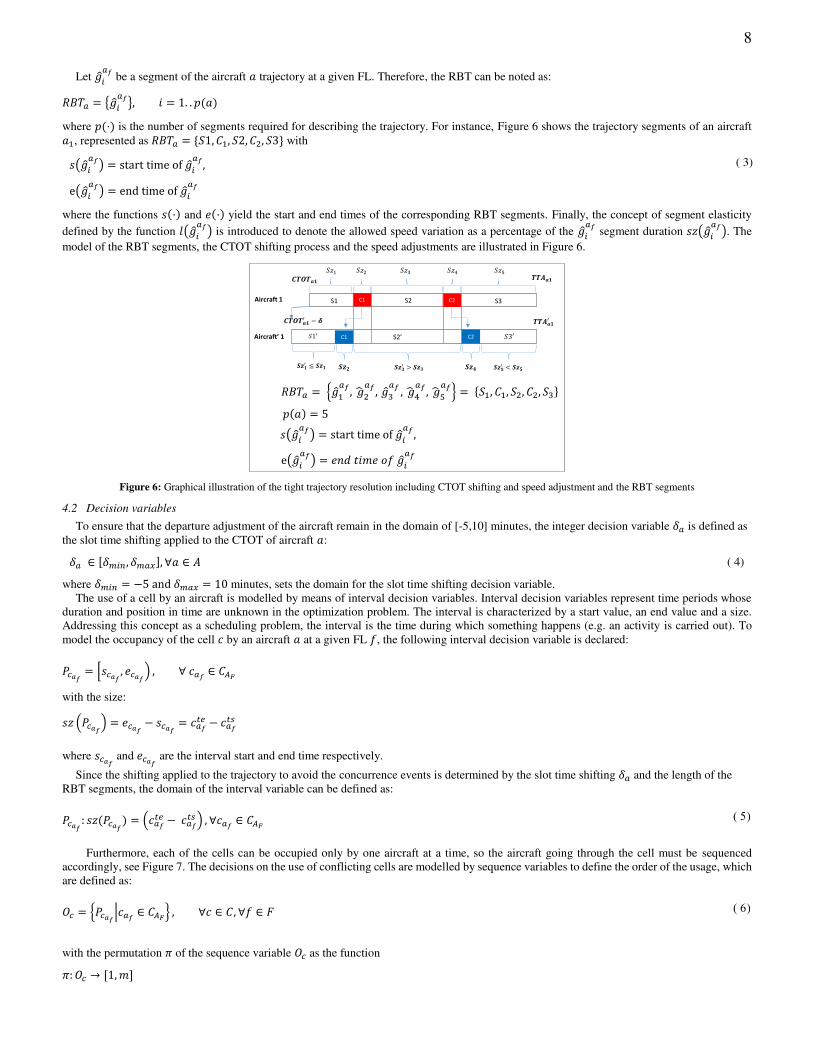
8
Let be a segment of the aircraft trajectory at a given FL. Therefore, the RBT can be noted as: = { }, = . .
where · is the number of segments required for describing the trajectory. For instance, Figure 6 shows the trajectory segments of an aircraft
, represented as = { , , , , } with ( ) = start time of , ( 3) e( ) = end time of
where the functions · and · yield the start and end times of the corresponding RBT segments. Finally, the concept of segment elasticity
defined by the function ( ) is introduced to denote the allowed speed variation as a percentage of the segment duration ( ). The
model of the RBT segments, the CTOT shifting process and the speed adjustments are illustrated in Figure 6.
Figure 6: Graphical illustration of the tight trajectory resolution including CTOT shifting and speed adjustment and the RBT segments
4.2 Decision variables
To ensure that the departure adjustment of the aircraft remain in the domain of [-5,10] minutes, the integer decision variable is defined as
the slot time shifting applied to the CTOT of aircraft : [ , ], ∀ ( 4)
where = −5 and = minutes, sets the domain for the slot time shifting decision variable.
The use of a cell by an aircraft is modelled by means of interval decision variables. Interval decision variables represent time periods whose
duration and position in time are unknown in the optimization problem. The interval is characterized by a start value, an end value and a size.
Addressing this concept as a scheduling problem, the interval is the time during which something happens (e.g. an activity is carried out). To
model the occupancy of the cell by an aircraft at a given FL , the following interval decision variable is declared:
� = [ � , � , ∀ �
with the size:
� = � − � = −
where � and � are the interval start and end time respectively.
Since the shifting applied to the trajectory to avoid the concurrence events is determined by the slot time shifting and the length of the
RBT segments, the domain of the interval variable can be defined as:
� : � = − , ∀ �
Furthermore, each of the cells can be occupied only by one aircraft at a time, so the aircraft going through the cell must be sequenced
accordingly, see Figure 7. The decisions on the use of conflicting cells are modelled by sequence variables to define the order of the usage, which
are defined as:
= { � | �} , ∀ , ∀
with the permutation of the sequence variable as the function : → [ , ]
Aircraft 1
Aircraft’ 1
C1 C2
C1 C2
S1
S2’
S2 S3

9
where = | | is the number of aircraft going through the cell . The elements of the sequence variable meet the following conditions: � ≠ � ⇒ � ≠ � , ∀ � , �
Figure 7: Illustration of the sequencing of the occupancy of the cell c by an aircraft � at a given FL (referred to as ��� ) in such a way that the cells can be
occupied only by one aircraft at a time.
In a second step, the segments of the RBT have to be modelled to be able to introduce speed changes which ensure that the TTA is met. In this
case, the duration of the entire flight becomes an unknown itself, since the CTOT can be shifted while intending to preserve the TTA.
Therefore, a decision interval variable is introduced for representing the entire flight: = [ , ( 7)
where will be the take-off time and the arrival time in the solution.
Secondly, the interval variables representing the segments of the solution trajectory are modelled. Let be the interval variable for a
segment of the RBT at a given FL:
= [s( ), ( ) , ∀ , ∀ , ∀ . .
and the size of the segment is ( ) = ( ) −
The domain of the segment can be defined as: ( ) [ ( ) − ( ), ( ) + ( )]
where ( ) is the elasticity of the segment that results from bounded speed adjustments. Therefore, the interval duration can differ from the
original RBT segment duration, since the bounded speed changes enable the elasticity ( ) of the segment. The domain for the interval start
and end time cannot be specified, since their solution values are a combination of the take-off slot time shift and the bounded speed adjustments.
Finally, an interval decision sequence variable is introduced to set the relationship between the trajectory segments and the entire
trajectory :
= { | ∀ , ∀ , . . } : → [ , ]
≠ ⇒ ( ) ≠ , ∀ ,
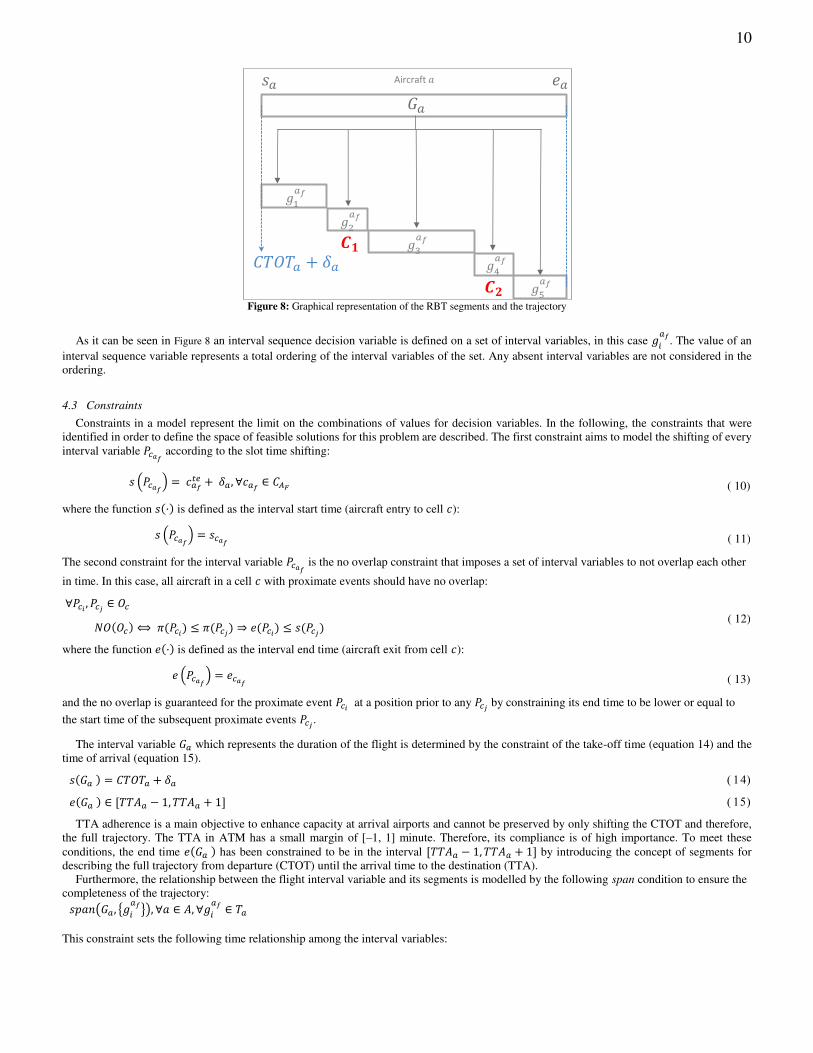
10
Figure 8: Graphical representation of the RBT segments and the trajectory
As it can be seen in Figure 8 an interval sequence decision variable is defined on a set of interval variables, in this case . The value of an
interval sequence variable represents a total ordering of the interval variables of the set. Any absent interval variables are not considered in the
ordering.
4.3 Constraints
Constraints in a model represent the limit on the combinations of values for decision variables. In the following, the constraints that were
identified in order to define the space of feasible solutions for this problem are described. The first constraint aims to model the shifting of every
interval variable � according to the slot time shifting:
� = + , ∀ � ( 10)
where the function · is defined as the interval start time (aircraft entry to cell ):
� = � ( 11)
The second constraint for the interval variable � is the no overlap constraint that imposes a set of interval variables to not overlap each other
in time. In this case, all aircraft in a cell with proximate events should have no overlap:
∀ ,
( 12) ⟺ ⇒
where the function · is defined as the interval end time (aircraft exit from cell ):
� = � ( 13)
and the no overlap is guaranteed for the proximate event at a position prior to any by constraining its end time to be lower or equal to
the start time of the subsequent proximate events .
The interval variable which represents the duration of the flight is determined by the constraint of the take-off time (equation 14) and the
time of arrival (equation 15). = + [ − , + ]
TTA adherence is a main objective to enhance capacity at arrival airports and cannot be preserved by only shifting the CTOT and therefore,
the full trajectory. The TTA in ATM has a small margin of [–1, 1] minute. Therefore, its compliance is of high importance. To meet these
conditions, the end time has been constrained to be in the interval [ − , + ] by introducing the concept of segments for
describing the full trajectory from departure (CTOT) until the arrival time to the destination (TTA).
Furthermore, the relationship between the flight interval variable and its segments is modelled by the following span condition to ensure the
completeness of the trajectory: ( , { }), ∀ , ∀
This constraint sets the following time relationship among the interval variables:
Aircraft

11
{ = min[ , ( )] { ( )}= max[ , ( )] { )}
( 16)
The constraint span states that the interval flight spans over all present intervals from the set segments. That is, interval flight starts together
with the first present segment interval and ends together with the last one.
Therefore, the following three constraints are set to order the trajectory segments:
1. The no overlap constraint to ensure that interval variables to not overlap each other. In this case, the individual RBT segments should have
no overlap. ⇔ < ⇒
2. The constraint that one segment has to start before the next: ( ) , ∀ , : <
3. The constraint that ensures that the start of segment takes place after the end of segment . ( ) = , ∀ , : = +
Moreover, the � interval variable, that is used in combination with the sequence variable to remove the concurrence events at cell ,
must be linked with the concurrence segments of the trajectory , since they are representing the same time windows. This is accomplished by
the following constraint:
{ ( ) = �( ) = � ⇔ ( ) =( ) = , ∀ �
( 20)
In summary, there are two interval variables: � that represents the occupancy of the cell by an aircraft at a given FL (equation 5) and
that represents the segment of the RBT at a given FL (equation 8). Both are scheduled over the pairing between the aircraft using a given
cell at a given FL modelled as (equation 2) ensuring with equation 20 that � and are linked to each other since they represent
the same time window, see Figure 9.
Figure 9: Graphical illustration of the use of the interval variables ��� and �� over the paring of the aircraft, cell and FL �� ���and the linkage between both
interval variables as expressed in equation 20.
Finally, the RBT segments of different FLs need to be synchronized to model the 3D concurrence event mitigation. Recalling the concurrence
event detection process described in Figure 3, the RBT exists in the lower and upper flight level during the FL change of the RBT. Therefore, the
synchronize constraint is used to synchronize the start and end of intervals (segments of the RBT), see Figure 10. This constraint makes all
present intervals in the array start and end together with interval , if it is present, while remaining with just one RBT segment to form
the trajectory (blue striped cell in Figure 10). The constraint that ensures that the RBT is recognized in both FL is defined as follows: ℎ [ ], { } , ∀ ( 21)
Aircraft
≡

12
Figure 10: Flight Level synchronization
4.4 Optimization goal
The objective function is expressed in a bi-objective optimization goal with the intention to bind the TTA on one hand and to minimize the
total aircraft slot time shifts on the other hand. However, it may occur that sometimes no solution can be found because time adjustment is
bounded and the slot time shifting cannot be compensated by the speed adjustments. For this reason, the TTA constraint is relaxed with the
following logical function:
= { , [ − , + ], otherwise
The bi-objective optimization goal that combines both aspects which are that minimizes the total aircraft slot time shifts, and that binds
the TTA is formulated as follows:
min ∑| |= + ∑=
where refers to the aircraft, is the slot time shift applied and represents the minimization of all RBT segments according to their
allowed elasticity if the TTA cannot be met.
The entire optimization model is listed here:
set of aircraft
set of cells that have a concurrence event
set of Flight Levels = {< , , > | ∀ , ∀ , ∀ } = { }, = . .
d.v. [ , ], ∀
d.v. � : � = − , ∀ �
d.v. = { � | �} , ∀ , ∀
d.v. = [ ,
d.v. = [ ( ), ( ) , ∀ , ∀ , ∀ . . :
( ) [ ( ) − ( ), ( ) + ( )] d.v. = { | ∀ , ∀ , . . }
minimize
∑ | |= + ∑ =
sub�ect to { � = +
∀ ,
⟺ < ⇒ = + [ − , + ] ( , { }), ∀ , ∀
∀ , ∀ , ∀ , . .
⇔ < ⇒
S1
S3
S5
synchronize synchronize
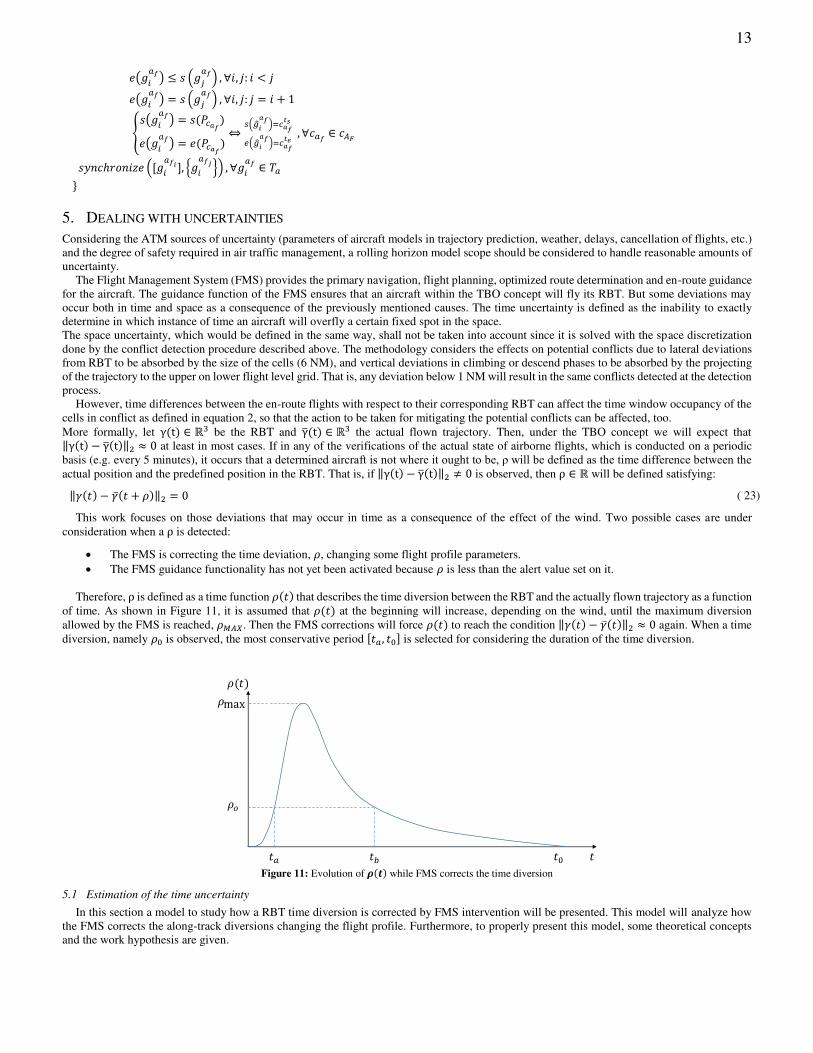
13
( ) , ∀ , : <
( ) = , ∀ , : = +
{ ( ) = �( ) = � ⇔ � = �� = � , ∀ �
ℎ [ ], { } , ∀
} 5. DEALING WITH UNCERTAINTIES
Considering the ATM sources of uncertainty (parameters of aircraft models in trajectory prediction, weather, delays, cancellation of flights, etc.)
and the degree of safety required in air traffic management, a rolling horizon model scope should be considered to handle reasonable amounts of
uncertainty.
The Flight Management System (FMS) provides the primary navigation, flight planning, optimized route determination and en-route guidance
for the aircraft. The guidance function of the FMS ensures that an aircraft within the TBO concept will fly its RBT. But some deviations may
occur both in time and space as a consequence of the previously mentioned causes. The time uncertainty is defined as the inability to exactly
determine in which instance of time an aircraft will overfly a certain fixed spot in the space.
The space uncertainty, which would be defined in the same way, shall not be taken into account since it is solved with the space discretization
done by the conflict detection procedure described above. The methodology considers the effects on potential conflicts due to lateral deviations
from RBT to be absorbed by the size of the cells (6 NM), and vertical deviations in climbing or descend phases to be absorbed by the projecting
of the trajectory to the upper on lower flight level grid. That is, any deviation below 1 NM will result in the same conflicts detected at the detection
process.
However, time differences between the en-route flights with respect to their corresponding RBT can affect the time window occupancy of the
cells in conflict as defined in equation 2, so that the action to be taken for mitigating the potential conflicts can be affected, too.
More formally, let γ t ℝ be the RBT and γ t ℝ the actual flown trajectory. Then, under the TBO concept we will expect that ‖γ t − γ t ‖ ≈ at least in most cases. If in any of the verifications of the actual state of airborne flights, which is conducted on a periodic
basis (e.g. every 5 minutes), it occurs that a determined aircraft is not where it ought to be, ρ will be defined as the time difference between the actual position and the predefined position in the RBT. That is, if ‖γ t − γ t ‖ ≠ is observed, then ρ ℝ will be defined satisfying: ‖ − + ‖ = ( 23)
This work focuses on those deviations that may occur in time as a consequence of the effect of the wind. Two possible cases are under
consideration when a ρ is detected:
The FMS is correcting the time deviation, , changing some flight profile parameters.
The FMS guidance functionality has not yet been activated because is less than the alert value set on it.
Therefore, ρ is defined as a time function that describes the time diversion between the RBT and the actually flown trajectory as a function
of time. As shown in Figure 11, it is assumed that at the beginning will increase, depending on the wind, until the maximum diversion
allowed by the FMS is reached, � . Then the FMS corrections will force to reach the condition ‖ − ‖ ≈ again. When a time
diversion, namely is observed, the most conservative period [ , ] is selected for considering the duration of the time diversion.
Figure 11: Evolution of � � while FMS corrects the time diversion
5.1 Estimation of the time uncertainty
In this section a model to study how a RBT time diversion is corrected by FMS intervention will be presented. This model will analyze how
the FMS corrects the along-track diversions changing the flight profile. Furthermore, to properly present this model, some theoretical concepts
and the work hypothesis are given.

14
5.1.1 Theoretical concepts of the 4D Navigation
A spatial waypoint is a three-dimensional point composed of longitude, latitude and altitude. In a 4-dimensional navigation a specific sequence
of spatial waypoints that are registered at a required time instance, and are commonly referred to as time stamps, are defined. In this context a set
of several variables and parameters which define the flight profile configuration, is specified in order to reach the 4D navigation points. The true
airspeed is considered as the most important control variable in the flight profile configuration to achieve a waypoint at a given timestamp,
according to (Mohleji, 1989).
True airspeed V A is the speed of the aircraft relative to the air mass in which it is flying. The vector relationship between the and the
speed with respect to the ground, VG , is: V A = VG ± VW , where VW is the wind speed vector. Aircraft flight instruments, however, do not
compute true airspeed as a function of groundspeed and wind speed. They use impact and static pressures as well as a temperature input. The
result is the true physical speed of the aircraft, relative to the surrounding body of air. To be more precise, at cruise level a flying aircraft uses as
a speed indicator the Mach number, , which relates the true airspeed with the speed of sound. The relation between this speed indicator and the
true airspeed is = · , where is the speed of sound, the speed at which the pressure waves travel through a fluid. More detailed and
rigorous formulation can be found in the BADA User Manual V 3.12 (Eurocontrol, 2014) and the Revision of atmosphere model in BADA aircraft
performance model 2010 (Eurocontrol, 2010).
A bearing refers to the direction or course that an aircraft has to take in order to reach a particular waypoint. The bearing of an aircraft over
the great circle track is not constant, however, when the distance between two waypoints is small, the initial bearing value is close to the final
bearing value. Hence, the initial bearing can be taken as a constant bearing value set on the aircraft FMS to reach a particular final waypoint, if
it is close enough. The most used expression to compute the initial bearing is (Williams, 2012): = sin − cos , cos sin − sin cos cos −
The last concept to be discussed is the time estimation and the wind effect. The time that an aircraft spends moving from an initial waypoint = , , to a final waypoint = , , can be represented as follows:
t = β( d|VG z |) ( 24)
where | | is the module of the ground airspeed vector of the aircraft at a given altitude , is the distance between the two waypoints and
is a conversion factor from knots to feet/seconds. However, since the ground speed is related to the true airspeed, the along-track wind has to be
taken into account to express equation 24 in terms of the true airspeed. The effect of the along-track wind over the aircraft true airspeed in cruise
level is associated with two elements (Mohleji, 1989):
The direction of the wind with respect to the aircraft bearing. Depending of the relationship between the heading of the along-track
wind and the aircraft, it is called tailwind or headwind.
The magnitude of the along-track wind which represents the constant speed of the wind at a given altitude (cruise altitude).
The along-track component of wind in the horizontal plane can be represented as follows: = cos | − ± �| ( 25)
where VW z is the speed of the wind at a given altitude, HW z is the heading of the wind at a given altitude, η is the factor to correct the
magnetic north to true north and the B is the Bearing of the aircraft’s track. With this expression, equation 24 can be rewritten in terms of the true
airspeed as follows:
t = β( d|V A z | ± W z ) ( 26)
RBT timestamps are obtained using equation 26 with the forecasted values. Predictive models are used to obtain wind velocity values
during the flight to estimate the timestamps associated to each waypoint. Time diversion can appear during the flight if the wind real velocity
values, , are different to the predicted ones, making the FMS acts in order to ensure TBO navigation concept. Therefore, the following
variable are defined in the model:
: The standard true airspeed for an aircraft at the cruise level.
: The maximum true airspeed for an aircraft at a cruise level.
: The ground speed of an aircraft computed taking into account the forecasted values for the winds, . Therefore, =± .
: The maximum ground speed of an aircraft computed taking into account the forecasted values for the winds.
∆ : The wind diversion between the forecasted winds and the actual ones, ∆ = − .
5.1.2 Working hypothesis of the model
In this section the working hypothesis for the model is described. The model will show how a time diversion detected by the FMS of an
aircraft will be reduced to zero ( = ).
1. The initial time diversion that makes FMS acts is half a minute long, ρ t = sec.
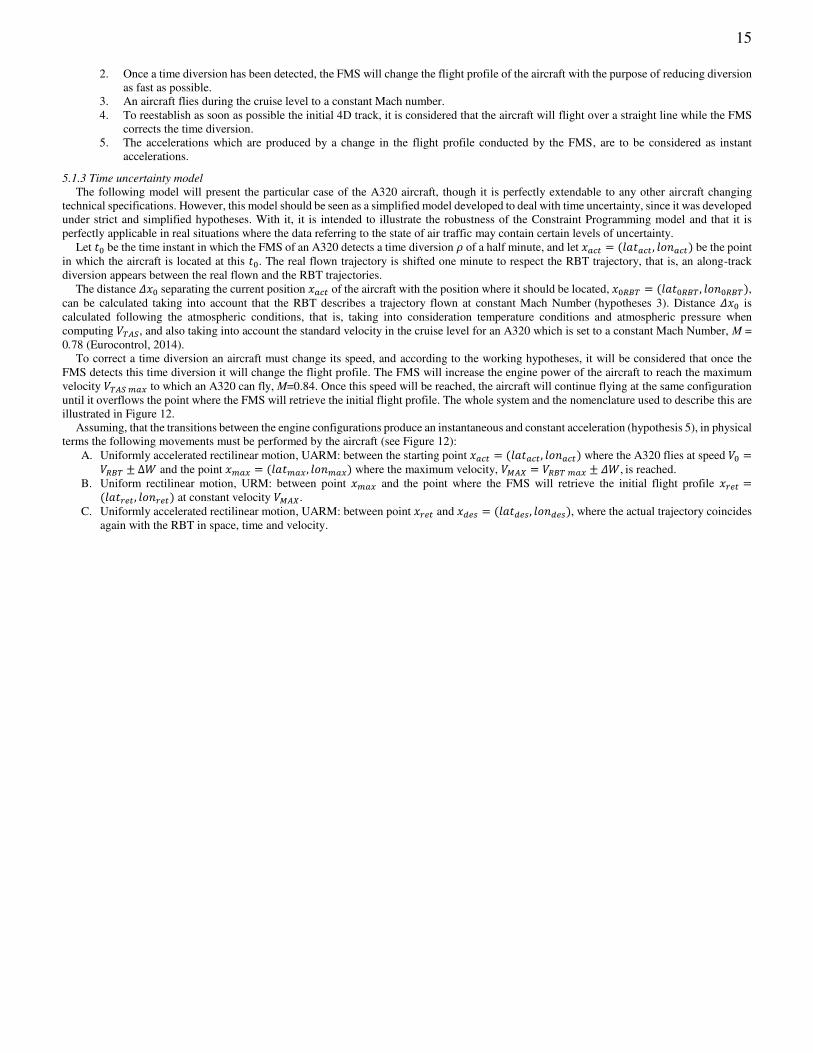
15
2. Once a time diversion has been detected, the FMS will change the flight profile of the aircraft with the purpose of reducing diversion
as fast as possible.
3. An aircraft flies during the cruise level to a constant Mach number.
4. To reestablish as soon as possible the initial 4D track, it is considered that the aircraft will flight over a straight line while the FMS
corrects the time diversion.
5. The accelerations which are produced by a change in the flight profile conducted by the FMS, are to be considered as instant
accelerations.
5.1.3 Time uncertainty model
The following model will present the particular case of the A320 aircraft, though it is perfectly extendable to any other aircraft changing
technical specifications. However, this model should be seen as a simplified model developed to deal with time uncertainty, since it was developed
under strict and simplified hypotheses. With it, it is intended to illustrate the robustness of the Constraint Programming model and that it is
perfectly applicable in real situations where the data referring to the state of air traffic may contain certain levels of uncertainty.
Let be the time instant in which the FMS of an A320 detects a time diversion of a half minute, and let = , be the point
in which the aircraft is located at this . The real flown trajectory is shifted one minute to respect the RBT trajectory, that is, an along-track
diversion appears between the real flown and the RBT trajectories.
The distance � separating the current position of the aircraft with the position where it should be located, = , ,
can be calculated taking into account that the RBT describes a trajectory flown at constant Mach Number (hypotheses 3). Distance � is
calculated following the atmospheric conditions, that is, taking into consideration temperature conditions and atmospheric pressure when
computing , and also taking into account the standard velocity in the cruise level for an A320 which is set to a constant Mach Number, M =
0.78 (Eurocontrol, 2014).
To correct a time diversion an aircraft must change its speed, and according to the working hypotheses, it will be considered that once the
FMS detects this time diversion it will change the flight profile. The FMS will increase the engine power of the aircraft to reach the maximum
velocity to which an A320 can fly, M=0.84. Once this speed will be reached, the aircraft will continue flying at the same configuration
until it overflows the point where the FMS will retrieve the initial flight profile. The whole system and the nomenclature used to describe this are
illustrated in Figure 12.
Assuming, that the transitions between the engine configurations produce an instantaneous and constant acceleration (hypothesis 5), in physical
terms the following movements must be performed by the aircraft (see Figure 12):
A. Uniformly accelerated rectilinear motion, UARM: between the starting point = , where the A320 flies at speed =± ∆ and the point = , where the maximum velocity, � = ± � , is reached.
B. Uniform rectilinear motion, URM: between point and the point where the FMS will retrieve the initial flight profile = , at constant velocity � .
C. Uniformly accelerated rectilinear motion, UARM: between point and = , , where the actual trajectory coincides
again with the RBT in space, time and velocity.

16
Figure 12: RBT vs. actual trajectory
Table 1: Equations of the three movements
Motion Space Time
UARM � − = � � = � −
URM � = � + � − � − � � = − � − � UARM � = − �
� = − �
The function , that is defined as the difference between the actual flown trajectory and the RBT for [ , ] (see Figure 11), can be
calculated by solving the system of equations of the three movements described in Table 1. The values of parameters and are given and
they depend on the aircraft type and the FMS system configuration. The authors in this work take the default values for and
specified in the BADA User Manual. To extend the function for the time interval [ , ] it is assumed that the time diversion will
increase until the FMS threshold will be reached. This increase will be calculated as a linear function taking into account the decrement in the
ground speed of the aircraft due to the along-track wind effect.
5.1.4 Application of the model to treat time uncertainties
Supposing, that at some instance tρ a time diversion ρ is detected, then for every occupancy time window that overlaps the period [ta, t ], the
new entry time to the concurrence event cell must be recalculated using ρ t . Since at tp it is unknown whether the function will decrease or
increase because current FMS technology reacts only, when a certain deviation is present (in this case 1 minute), all possible cases must be

17
covered by the solution space. Considering the starting position tp, there are two possible evolutions (see Figure 13) of the time diversion function ρ t :
1. The time diversion grows until the FMS guidance functionality is activated again
2. recovers the delay
Figure 13: Effects of time diversion on conflict window.
Therefore, the times and for each concurrence event in the period [ , ] must be calculated for the two discussed cases and the best case
for the start time and the worst case for the end time should be considered to ensure the required safety degree. It may happen that
the new occupancy time of the cell will change, since the aircraft is changing its flight profile. Therefore, following condition is added to the CP
model: + ≡ ( 27) + ≡
6. APPLICATION AND EXPERIMENTAL RESULTS
The CP model was applied to four different realistic traffic scenarios obtained from Eurocontrol Demand Data Repository (DDR2)
(Eurocontrol, 2017a). As stated by Eurocontrol, these data provide the most accurate picture of pan-European air traffic demand, from several
years ahead until the day before operations. It can be used to support the Network Collaborative Planning Process that include strategic, seasonal
and pre-tactical planning as well as for the planning of special events or major ATM evolution projects. Furthermore, the data offers improved
4D trajectories that are more accurate as all meaningful points are kept. Since the presented method highly relies on 4D trajectories this source
of data was chosen. In this case, the input traffic data has been extracted by the Network Strategic Tool - NEST (EUROCONTROL) inside the
Airspace Sector 1609, which is a dense traffic area at the en-route airspace sector above BeNeLux airspace.
To take the seasonality patterns in the aviation industry into account as stated in (ICAO, 2006), the scenarios were selected respectively.
According to (European Commission, Eurocontrol and US Department of Transportation, 2016), the European traffic shows a clear peak during
the summer months which, compared to average, has a 15% higher traffic volume. In this work, one traffic scenario was chosen in the winter
period (January) and one traffic scenario was chosen in the summer period (July). Both days have two 1h traffic samples, one in the morning,
and one in the afternoon to consider the daily traffic distribution. Table 2 shows the amount of concurrence events and RBTs of each scenario.
The mapping of the traffic scenario for a given day takes less than 5 minutes in a standard desktop computer and the concurrence events detection
of 2h of traffic takes less than 2 seconds.
Table 2: Information about the traffic scenarios
Scenario Date Time RBTs Concurrence events
Scenario 1 05.12.2017 08:00-09:00 44 59
Scenario 2 05.12.2017 15:00-16:00 55 79
Scenario 3 17.07.2017 08:00-09:00 44 49
Scenario 4 17.07.2017 15:00-16:00 121 216
In the first set of experiments, we assumed TBO without uncertainties. In a second set of experiments, trajectories are manually modified
creating a synthetic traffic scenario that considers uncertainties. A microanalysis is performed with a zoom into the cells to illustrate the effect of
the uncertainty. In both experiments, the trajectories were discretized at each second, and each position was specified in terms of geographic
coordinates and a time stamp. The cell size for the conflict detection was set to 6NM considering FL 190 to FL 460. The CP model has been
implemented in Java and the following results were obtained. The solver was limited to 60 seconds to get the best suboptimal solution. All the
experiments were performed on a Windows 7 computer with an Intel Core I5-4300M CPU 2.60GHz and 8GB RAM.
Occupancy at cell
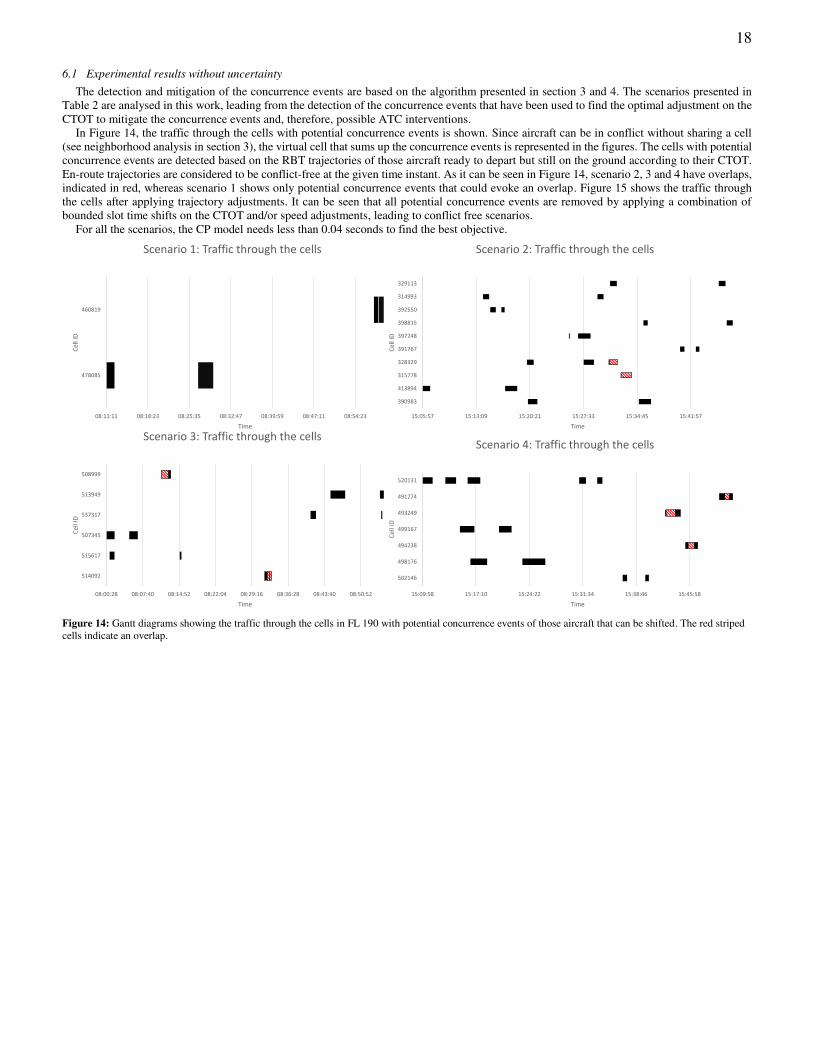
18
6.1 Experimental results without uncertainty
The detection and mitigation of the concurrence events are based on the algorithm presented in section 3 and 4. The scenarios presented in
Table 2 are analysed in this work, leading from the detection of the concurrence events that have been used to find the optimal adjustment on the
CTOT to mitigate the concurrence events and, therefore, possible ATC interventions.
In Figure 14, the traffic through the cells with potential concurrence events is shown. Since aircraft can be in conflict without sharing a cell
(see neighborhood analysis in section 3), the virtual cell that sums up the concurrence events is represented in the figures. The cells with potential
concurrence events are detected based on the RBT trajectories of those aircraft ready to depart but still on the ground according to their CTOT.
En-route trajectories are considered to be conflict-free at the given time instant. As it can be seen in Figure 14, scenario 2, 3 and 4 have overlaps,
indicated in red, whereas scenario 1 shows only potential concurrence events that could evoke an overlap. Figure 15 shows the traffic through
the cells after applying trajectory adjustments. It can be seen that all potential concurrence events are removed by applying a combination of
bounded slot time shifts on the CTOT and/or speed adjustments, leading to conflict free scenarios.
For all the scenarios, the CP model needs less than 0.04 seconds to find the best objective.
Figure 14: Gantt diagrams showing the traffic through the cells in FL 190 with potential concurrence events of those aircraft that can be shifted. The red striped
cells indicate an overlap.
08:11:11 08:18:23 08:25:35 08:32:47 08:39:59 08:47:11 08:54:23
478085
460819
Time
Ce
ll I
D
Scenario 1: Traffic through the cells
15:09:58 15:17:10 15:24:22 15:31:34 15:38:46 15:45:58
502146
498176
494238
499167
493249
491274
520131
Time
Ce
ll I
D
Scenario 4: Traffic through the cells
15:05:57 15:13:09 15:20:21 15:27:33 15:34:45 15:41:57
390983
413894
315778
328329
391767
397248
398815
392550
314993
329113
Time
Ce
ll I
D
Scenario 2: Traffic through the cells
08:00:28 08:07:40 08:14:52 08:22:04 08:29:16 08:36:28 08:43:40 08:50:52
514092
515617
507345
537317
513949
508999
Time
Ce
ll I
D
Scenario 3: Traffic through the cells

19
Figure 15: Traffic through the cells in FL 190 after applying the CP model solution. The diagram shows the conflict free solution after applying small
adjustments on the CTOT and segment speed.
In Figure 16 (a), the number of aircraft that participate in a concurrence event, the number of aircraft whose CTOT can be modified, meaning
they are still on the ground, and the number of actual shifted aircraft to solve the concurrence events for each scenario is shown. The distribution
of the applied shifts on the CTOT gather around 0 minutes, see Figure 16 (b). This can be explained by the objective function that was defined
in equation 22 that aims at minimizing the slot time shifts. The amount of concurrence events and RBTs which are around four times higher in
scenario 4 than in the rest of the scenarios (see Table 2) do not influence the solution significantly.
Figure 16: Diagrams showing the domain of the CP model and its solution. Diagram (a) shows how many aircraft are involved in a concurrence event, which
of those aircraft are on the ground and can be modified and the solution which answers on how many of these aircraft have been modified to have conflict free
traffic. (b) shows the distribution of the solution in shifted minutes on the CTOT.
6.2 Experimental results considering TBO time-uncertainty
Under the assumptions stated in section 5, the effects on the time diversion on the conflict window can be seen in Figure 17. For this
experiment, a headwind of 50 knots or 92.6 km/h at FL 360 was assumed (ATSC113, 2017). The total time needed to recover the time diversion
in this case is 10.6 minutes (636 seconds).
08:11:11 08:18:23 08:25:35 08:32:47 08:39:59 08:47:11 08:54:23
478085
460819
Time
Ce
ll I
DScenario 1: Traffic through the cells after mitigation
15:05:57 15:13:09 15:20:21 15:27:33 15:34:45 15:41:57
390983
413894
315778
328329
391767
397248
398815
392550
314993
329113
Time
Ce
ll I
D
Scenario 2: Traffic through the cells after mitigation
15:09:58 15:17:10 15:24:22 15:31:34 15:38:46 15:45:58
502146
498176
494238
499167
493249
491274
520131
Time
Ce
ll I
D
Scenario 4: Traffic through the cells after mitigation
08:00:28 08:07:40 08:14:52 08:22:04 08:29:16 08:36:28 08:43:40 08:50:52
514092
515617
507345
537317
513949
508999
Time
Ce
ll I
D
Scenario 3: Traffic through the cells after mitigation
0
1
2
3
4
5
6
7
8
min
ute
s
min
ute
s
min
ute
s
min
ute
s
min
ute
s
min
ute
s
min
ute
s
min
ute
s
min
ute
s
min
ute
s
min
ute
s
min
ute
s
min
ute
s
min
ute
s
min
ute
s
min
ute
s
-5 -4 -3 -2 -1 0 1 2 3 4 5 6 7 8 9 10
Am
ou
nt
of
air
cra
ft
Distribution of CTOT modification
1 05.12.2017 08:00-09:00am 2 05.12.2017 05:00-16:00pm
3 14.07.2017 08:00-09:00am 4 14.07.2017 15:00-16:00pm
(a) (b)
0
2
4
6
8
10
12
14
05.12.2017 08:00-09:00am 05.12.2017 05:00-16:00pm 14.07.2017 08:00-09:00am 14.07.2017 15:00-16:00pm
Am
ou
nt
of
air
cra
ft
Domain of the CP model
total flights with concurrence events eligible for shifting shifted

20
Figure 17: Effects of time diversion � � on conflict window of the experiment
To demonstrate the effect of the TBO time uncertainty on the concurrence event cells, the aircraft of scenario 1 have been modified. The
modification was applied in such a way that half of the aircraft that are involved in a concurrence event and that belong to the solution space of
the CP model, meaning that at least one of the aircraft in the concurrence event is still on the ground, are delayed. The size of the buffer which is
added to the concurrence event cell is calculated as explained in equation 27. It was assumed, that the time diversion was detected 5 minutes
before the first concurrence event of the aircraft.
Figure 18: The diagram shows scenario 1 introducing a time diversion. Black time window represents the regular usage of the aircraft in the cell, green color
indicates the safety buffer that was added to the time window and the red-striped color indicates an overlap. In cell 460819 a new overlap was evoked due to the
shifting of one aircraft. In cell 478085 the safety buffer that is added to the cell which results as a consequence of the shifting of the aircraft can be seen in green
colour.
The influence of the time diversion can be seen in Figure 18. In cell 478085 it can be seen that the first time window has increased in time.
The green color indicates the safety buffer that was added to the time window which represents the usage of the aircraft in the cell according to
equation 27. In cell 460819, the delay of the aircraft has evoked a new overlap. The CP model solves this concurrence event by applying a delay
of -1 minute on the CTOT of one aircraft.
6.3 Other results
Despite the results of scenario 1-4 that are illustrated in this work, studies have been performed in previous work (Schefers et al. 2016)
demonstrating the impact of the speed adjustments. In summary, an over-stressed realistic scenario composed of a set of 4,010 real 4D trajectories
-5
0
5
10
15
20
25
30
35
-200 0 200 400 600 800 1000 1200
Tim
e d
ive
rsio
n ( )
Absolute time in sec.
Effects of time diversion on conflict window
Evolution of ρ(t) when FMS is
correcting ρ(t)
Evolution of ρ(t) until the FMS
guidance functionality is
activated again
08:12:11 08:19:23 08:26:35 08:33:47 08:40:59 08:48:11 08:55:23
478085
460819
Time
Ce
ll I
D
Scenario 1 introducing uncertainty
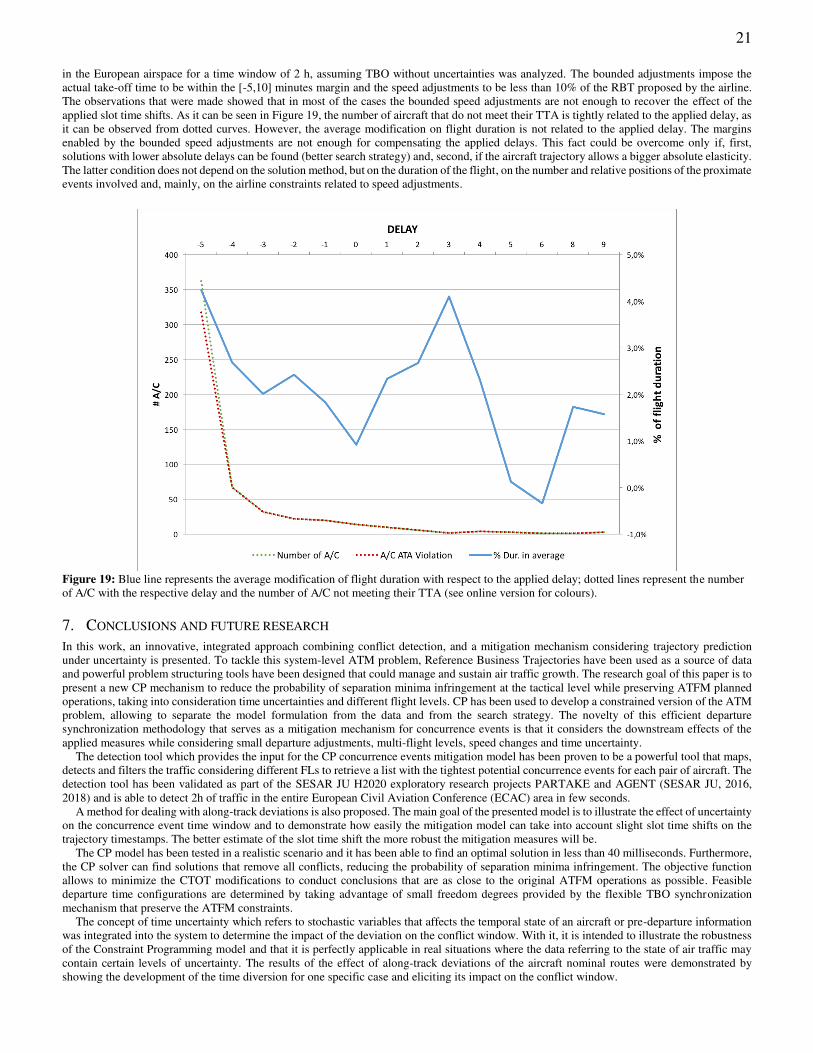
21
in the European airspace for a time window of 2 h, assuming TBO without uncertainties was analyzed. The bounded adjustments impose the
actual take-off time to be within the [-5,10] minutes margin and the speed adjustments to be less than 10% of the RBT proposed by the airline.
The observations that were made showed that in most of the cases the bounded speed adjustments are not enough to recover the effect of the
applied slot time shifts. As it can be seen in Figure 19, the number of aircraft that do not meet their TTA is tightly related to the applied delay, as
it can be observed from dotted curves. However, the average modification on flight duration is not related to the applied delay. The margins
enabled by the bounded speed adjustments are not enough for compensating the applied delays. This fact could be overcome only if, first,
solutions with lower absolute delays can be found (better search strategy) and, second, if the aircraft trajectory allows a bigger absolute elasticity.
The latter condition does not depend on the solution method, but on the duration of the flight, on the number and relative positions of the proximate
events involved and, mainly, on the airline constraints related to speed adjustments.
Figure 19: Blue line represents the average modification of flight duration with respect to the applied delay; dotted lines represent the number
of A/C with the respective delay and the number of A/C not meeting their TTA (see online version for colours).
7. CONCLUSIONS AND FUTURE RESEARCH
In this work, an innovative, integrated approach combining conflict detection, and a mitigation mechanism considering trajectory prediction
under uncertainty is presented. To tackle this system-level ATM problem, Reference Business Trajectories have been used as a source of data
and powerful problem structuring tools have been designed that could manage and sustain air traffic growth. The research goal of this paper is to
present a new CP mechanism to reduce the probability of separation minima infringement at the tactical level while preserving ATFM planned
operations, taking into consideration time uncertainties and different flight levels. CP has been used to develop a constrained version of the ATM
problem, allowing to separate the model formulation from the data and from the search strategy. The novelty of this efficient departure
synchronization methodology that serves as a mitigation mechanism for concurrence events is that it considers the downstream effects of the
applied measures while considering small departure adjustments, multi-flight levels, speed changes and time uncertainty.
The detection tool which provides the input for the CP concurrence events mitigation model has been proven to be a powerful tool that maps,
detects and filters the traffic considering different FLs to retrieve a list with the tightest potential concurrence events for each pair of aircraft. The
detection tool has been validated as part of the SESAR JU H2020 exploratory research projects PARTAKE and AGENT (SESAR JU, 2016,
2018) and is able to detect 2h of traffic in the entire European Civil Aviation Conference (ECAC) area in few seconds.
A method for dealing with along-track deviations is also proposed. The main goal of the presented model is to illustrate the effect of uncertainty
on the concurrence event time window and to demonstrate how easily the mitigation model can take into account slight slot time shifts on the
trajectory timestamps. The better estimate of the slot time shift the more robust the mitigation measures will be.
The CP model has been tested in a realistic scenario and it has been able to find an optimal solution in less than 40 milliseconds. Furthermore,
the CP solver can find solutions that remove all conflicts, reducing the probability of separation minima infringement. The objective function
allows to minimize the CTOT modifications to conduct conclusions that are as close to the original ATFM operations as possible. Feasible
departure time configurations are determined by taking advantage of small freedom degrees provided by the flexible TBO synchronization
mechanism that preserve the ATFM constraints.
The concept of time uncertainty which refers to stochastic variables that affects the temporal state of an aircraft or pre-departure information
was integrated into the system to determine the impact of the deviation on the conflict window. With it, it is intended to illustrate the robustness
of the Constraint Programming model and that it is perfectly applicable in real situations where the data referring to the state of air traffic may
contain certain levels of uncertainty. The results of the effect of along-track deviations of the aircraft nominal routes were demonstrated by
showing the development of the time diversion for one specific case and eliciting its impact on the conflict window.

22
Current forecasts and real-time locating systems and technologies are quite advanced. However, the here presented tools strongly rely on
precise RBT information. Therefore, the methods explained in this article could be of greater importance from an operational point of view with
the maturing of real-time information systems and the advancement of collaborative decision-making tools. Until the improvement of real-time
information systems, future research could be carried out to understand the time window of look-ahead time in which the presented tools are the
most effective.
During the experiments, it resulted that the amount of traffic is not an indicator for the number of concurrence events. It might be possible,
that the complexity of the traffic and trajectory interdependencies effect the number of concurrence events. Future research should be dedicated
towards analyzing trajectory interdependencies to support the CP solver to find optimal solutions, to determine the optimal airspace volume and
the optimal environment for implementation (i.e. at airports with a lot of traffic movements) of the tools. It is also worth to mention the necessity
to extend the mitigation model in order to include other operational constraints issued by Airports and Airspace Users. For instance, to ensure
the proper use of the runway with additional information from the AMAN/DMAN, or the existence multiple runway feeders, etc. These kind of
operational constraints can be easily added into the proposed CP model. This is one of the main advantages of the Constraint Programming
paradigm. Finally, it would be of interest to study the development of the presented methodologies in a rolling horizon to see the reduction of the
probability of separation minima infringement and ATC interventions.
Acronyms
Meaning
4D or 4DT Trajectory described in terms of 3 spatial dimensions and time stamps
4-dimensional trajectories
AI Artificial Intelligence
ATFM Air Traffic Flow Management
ATFCM Air Traffic Flow and Capacity Management
ATC Air Traffic Control
ATM Air Traffic Management
AU/AUs Airspace user/ users
CD&R Conflict Detection and Resolution
CP Constraint Programming
CSP Constraint Satisfaction Problem
CTOT Calculated Take-Off Time
DA Data Analytics
DDR2 EUROCONTROL Demand and Data Repository
DST Decision Support Tools
ECAC European Civil Aviation Conference
FL Flight Level
FMS Flight Management System
JJSP Job Shop Scheduling Problem
NM Nautical Miles
RBT Reference Business Trajectory
SDS Spatial Data Structure
SESAR Single European Sky ATM Research
SOCSP Single Objective Optimization Constrained Scheduling Problem
STAM Short-Term ATFCM Measures
SWIM System Wide Information Management
TBO Trajectory Based Operations
TMA Terminal Manoeuvring Area
TTA Target Time of Arrival

23
ACKNOWLEDGEMENTS
This research is supported by the European Union’s Horizon 2020 research and innovation program. The Project related to this research is
PARTAKE “Cooperative departures for a competitive ATM network service” with Grant Agreement No. 699307.
REFERENCES
Adacher, L., Flamini, M. and Romano, E. (2017) ‘Rerouting algorithms solving the air traffic congestion Advanced PID tuning based on the modulus optimum
method for real systems Rerouting Algorithms Solving The Air Traffic Congestion’, International Conference on Applied Mathematics and Computer Science
AIP Conference Proceedings AIP Conference Proceedings, 10(10), pp. 20053–20060. doi: 10.1063/1.4981999.
Allignol, C., Barnier, N., Flener, P. and Pearson, J. (2012) ‘Constraint programming for air traffic management : a survey Constraint programming for air traffic
management : a survey Constraint programming for air traffic management: A survey In memory of Pascal Brisset’, Knowledge Engineering Review. Cambridge
University Press Cambridge University Press, 270(00), pp. 361–392. doi: 10.1017/S000000000000000.
ATSC113 (2017) UBC ATSC113 crosswinds and headwinds. Available at: https://www.eoas.ubc.ca/courses/atsc113/flying/met_concepts/02-met_concepts/02d-
crosswind/index.html (Accessed: 29 January 2018).
Barnier, N. and Allignol, C. (2009) ‘4D-trajectory deconfliction through departure time adjustment’, in 8th USA/Europe Air Traffic Management Research and
Development Seminar.
Barnier, N. and Brisset, P. (2004) ‘Graph Coloring for Air Traffic Flow Management’, Annals of Operations Research. Kluwer Academic Publishers, 130(1–4),
pp. 163–178. doi: 10.1023/B:ANOR.0000032574.01332.98.
Van Beek, P. (2006) ‘Chapter 4 Backtracking search algorithms’, in Handbook of Constraint Programming. Elsevier B.V., pp. 85–134. doi: 10.1016/S1574-
6526(06)80008-8.
Bessiere (2006) ‘Constraint Propagation’, Elsevier, (Handb. Constraint Program.), p. chapter 3, pages 29–83.
Casado, Goodchild and Vilaplana (2012) ‘Identification and Initial Characterization of Sources of Uncertainty Affecting the Performance of Future Trajectory
Management Automation Systems’, in Proceedings of the 2nd International Conference on Application and Theory of Automation in Command and Control
Systems. IRIT Press Toulouse, France, pp. 170–175.
Castelli, L., Pesenti, R. and Ranieri, A. (2011) ‘The design of a market mechanism to allocate Air Traffic Flow Management slots’, Transportation Research
Part C: Emerging Technologies, 19(5), pp. 931–943. doi: 10.1016/j.trc.2010.06.003.
Chaimatanan, S., Delahaye, D. and Mongeau, M. (2018) ‘Hybrid metaheuristic for air traffic management with uncertainty’, in Amodeo, L., Talbi, E., and
Yalaoui, F. (eds) Recent developments of metaheuristic, pp. 219–25.
Chemla, D., Diaz, D., Kerlirzin, P. and Manchon, S. (1995) ‘Using clp(FD) to Support Air Traffic Flow Management’, in 3rd International Conference on the
Practical Application of Prolog. Paris, France.
Çinar, E. and Demirel, S. (2017) ‘EUROCONTROL SLOT ALLOCATION METHODOLOGY AND NEW APPROACH FOR CALCULATED TAKE OFF TIMES (CTOT): ALTERNATIVE CTOT VERSUS CTOT’, 18(1), pp. 69–77. doi: 10.18038/aubtda.300428.
Envisa (2017) Environmental Costs and Benefits of Ground Delay - Envisa - Aviation & Environmental Solutions. Available at: http://www.env-
isa.com/en/expertise/environmental-costs-and-benefits-of-ground-delay-2/ (Accessed: 15 May 2017).
Eurocontrol (2010) EUROCONTROL EXPERIMENTAL CENTRE REVISION OF ATMOSPHERE MODEL IN BADA AIRCRAFT PERFORMANCE MODEL.
Eurocontrol (2014) ‘USER MANUAL FOR THE BASE OF AIRCRAFT DATA (BADA) REVISION 3.12’.
Eurocontrol (2017a) Demand Data Repository (DDR) | Eurocontrol. Available at: http://www.eurocontrol.int/ddr (Accessed: 28 December 2017).
Eurocontrol (2017b) Short-term ATFCM measures: building on the local flow management process | Eurocontrol. Available at:
https://www.eurocontrol.int/articles/short-term-atfcm-measures-building-local-flow-management-process (Accessed: 29 September 2017).
Eurocontrol (2017c) Trajectory-Based Operations - EUROCONTROL ATM Lexicon. Available at: https://ext.eurocontrol.int/lexicon/index.php/Trajectory-
Based_Operations (Accessed: 2 December 2017).
European Commission, Eurocontrol and US Department of Transportation (2016) ‘Comparison of Air Traffic Management-Related Operational Performance:
U.S./Europe 2 0 15’. Available at: https://www.faa.gov/air_traffic/publications/media/us_eu_comparison_2015.pdf (Accessed: 29 December 2017).
Ferguson, J., Kara, A. Q., Hoffman, K. and Sherry, L. (2013) ‘Estimating Domestic U.S. Airline Cost of Delay based on European Model’, Transportation
Research Part C: Emerging Technologies, 33, pp. 311–323.
Flener, P., Pearson, J., Garcia-Avello, C., Ç eliktin, M. and Dissing, S. (2007) ‘Air-Traffic Complexity Resolution in Multi-Sector Planning Using Constraint

24
Programming Directorate of ATM Programmes, ATC Applications and Systems Division Directorate of ATM Strategies, SESAR and ATM Strategy Division
Directorate of ATM Programmes, Comm’, in FAA/EUROCONTROL (ed.) Proceedings of the USA/FAA Air Traffic Management R&D Seminar 2007.
Barcelona, Spain, p. 378.
Van Hentenryck, P., Simonis, H. and Dincbas, M. (1992) ‘Constraint satisfaction using constraint logic programming’, Artificial Intelligence. Elsevier Science
Publishers Ltd., 58(1–3), pp. 113–159. doi: 10.1016/0004-3702(92)90006-J.
IATA (2017) IATA - IATA Forecasts Passenger Demand to Double Over 20 Years. Available at: http://www.iata.org/pressroom/pr/Pages/2016-10-18-02.aspx
(Accessed: 2 December 2017).
IBM (2015) IBM ILOG CPLEX Optimization Studio OPL Language User’s Manual. Version 12. Edited by IBM.
ICAO (2006) ‘International Civil Aviation Organization Manual on Air Traffic Forecasting’. Available at: https://www.icao.int/MID/Documents/2014/Aviation
Data Analyses Seminar/8991_Forecasting_en.pdf (Accessed: 29 December 2017).
ICAO (2016) ‘Doc 4444’, in Procedures for Air Navigation Services Air Traffic Management. Montréal, Quebec, Canada, pp. 1–464.
Kerlirzin, P., Manchon, S., Plusquellec, C. and Gotteland, J. B. (2000) ‘Building and evaluating a minimal regulation scheme’, in 3rd USA/Europe Air Traffic
Management Research and Development Seminar. Napoles, Italy.
Kuenz (2015) High Performance Conflict Detection and Resolution for Multi-Dimensional Objects. Gottfried Wilhelm Leibniz Universität Hannover, Germany.
Van Leeuwen, P., Van, N. and Houwert, H. (2003) Scheduling aircraft using constraint relaxation.
Liang, M., Delahaye, D. and Maréchal, P. (2017) ‘Integrated sequencing and merging aircraft to parallel runways with automated conflict resolution and
advanced avionics capabilities’, Transportation Research Part C: Emerging Technologies, 85, pp. 268–291. doi: 10.1016/j.trc.2017.09.012.
Marcella, S., Andrea, D., Paolo, D. and Pacciarelli, D. (2017) ‘Scheduling models for optimal aircraft traffic control at busy airports: Tardiness, priorities, equity
and violations considerations’, Omega. Pergamon, 67, pp. 81–98. doi: 10.1016/J.OMEGA.2016.04.003.
Marriott, K. and Stuckey, P. J. (1998) Programming with constraints : an introduction. MIT Press.
Masalonis, A. J., Callaham, M. B. and Wanke, C. R. (2003) ‘DYNAMIC DENSITY AND COMPLEXITY METRICS FOR REALTIME TRAFFIC FLOW MANAGEMENT’, in Budapest/ Hungary 5th USA/ Europe Air Traffic Management R&D Seminar.
Mohleji, S. C. (1989) ‘Optimal flight management system utilization with ATC automation’, IEEE Aerospace and Electronic Systems Magazine, 4(2), pp. 26–32.
doi: 10.1109/62.16993.
Mondoloni, S. (2006) ‘Aircraft Trajectory Prediction Errors: Including a Summary of Error Sources and Data (Version 0.2) FAA/Eurocontrol Action Plan 16
Common Trajectory Prediction Capabilities’. Available at: https://acy.tc.faa.gov/data/_uploaded/Publications/tjm/TP_Sens_v02.pdf (Accessed: 11 December
2017).
Netjasov, F., Janić, M. and Tošić, V. (2011) ‘Developing a generic metric of terminal airspace traffic complexity’, Transportmetrica. Taylor & Francis Group,
7(5), pp. 369–394. doi: 10.1080/18128602.2010.505590.
Nosedal, J., Piera, M. A., Ruiz, S. and Nosedal, A. (2014) ‘An efficient algorithm for smoothing airspace congestion by fine-tuning take-off times’, Transportation Research Part C: Emerging Technologies. Elsevier Ltd, 44, pp. 171–184. doi: 10.1016/j.trc.2014.03.017.
Nosedal, J., Piera, M. A., Solis, A. O. and Ferrer, C. (2015) ‘An optimization model to fit airspace demand considering a spatio-temporal analysis of airspace
capacity’, Transportation Research Part C: Emerging Technologies. Elsevier Ltd, 61, pp. 11–28. doi: 10.1016/j.trc.2015.10.011.
Pabst, T., Kunze, T., Schultz, M. and Fricke, H. (2013) ‘Modeling external disturbances for aircraft in flight to build reliable 4D trajectories’, in 3rd International
Conference on Application and Theory of Automation in Command and Control Systems. Napoli, Italy.
Piera, M. A., Ramos, J. J., Moreno, R. and Narciso, M. (2014) ‘Causal simulation models for facing third millennium air transport sustainability’, SIMULATION.
SAGE PublicationsSage UK: London, England, 90(2), pp. 162–170. doi: 10.1177/0037549712469247.
Qian, X., Mao, J., Chen, C.-H., Chen, S. and Yang, C. (2017) ‘Coordinated multi-aircraft 4D trajectories planning considering buffer safety distance and fuel
consumption optimization via pure-strategy game’, Transportation Research Part C: Emerging Technologies. Pergamon, 81, pp. 18–35. doi:
10.1016/J.TRC.2017.05.008.
Rossi, F., Van Beek, P. and Walsh, T. (2006) ‘Handbook of Constraint Programming’, Elsevier.
Rossi, F. and Saraswat, V. (2006) ‘Constraint Programming Languages for Big Data Applications’.
Ruiz, S., Piera, M. A., Nosedal, J. and Ranieri, A. (2014) ‘Strategic de-confliction in the presence of a large number of 4D trajectories using a causal modeling
approach’, Transportation Research Part C: Emerging Technologies. Pergamon, 39, pp. 129–147. doi: 10.1016/J.TRC.2013.12.002.

25
Ruiz, S., Piera, M. A. and Del Pozo, I. (2013) ‘A Medium Term Conflict Detection and Resolution system for Terminal Maneuvering Area based on Spatial Data
Structures and 4D Trajectories’, Transportation Research Part C: Emerging Technologies. Pergamon, 26, pp. 396–417. doi: 10.1016/J.TRC.2012.10.005.
Schefers, N., Ramos, J. J. and Nosedal, J. (2016) ‘An efficient constraint programming model for cooperative flight departures’, Proceedings of HMS 2016, pp.
13–22. Available at: http://www.msc-les.org/proceedings/hms/hms2016/hms2016_13.html (Accessed: 10 August 2018).
Sesar (2015) ‘THE ROADMAP FOR DELIVERING HIGH PERFORMING AVIATION FOR EUROPE European ATM Master Plan’, Edition 20, p. 126.
SESAR JU (2016) Agent. Available at: http://www.agent-aero.eu/ (Accessed: 31 January 2018).
SESAR JU (2018) Partake. Available at: http://www.partake-aero.eu/ (Accessed: 18 January 2018).
SKYbrary (2017) 4D Trajectory Concept - SKYbrary Aviation Safety. Available at: https://www.skybrary.aero/index.php/4D_Trajectory_Concept (Accessed: 19
November 2017).
Trandac, H., Baptiste, P. and Duong, V. (2005) ‘Airspace sectorization with constraints’, RAIRO - Operations Research. EDP Sciences, 39(2), pp. 105–122. doi:
10.1051/ro:2005005.
Tselios, D. C., Savvas, I. K. and Kechadi, M. T. (2013) ‘Multiple project portfolio scheduling using recurrent neural networks’, International Journal of
Simulation and Process Modelling, 8(4), p. 227. doi: 10.1504/IJSPM.2013.059421.
Vilardaga, S. and Prats, X. (2015) ‘Operating cost sensitivity to required time of arrival commands to ensure separation in optimal aircraft 4D trajectories’, Transportation Research Part C: Emerging Technologies. Pergamon, 61, pp. 75–86. doi: 10.1016/J.TRC.2015.10.014.
Wang, Z., Liang, M. and Delahaye, D. (2017) ‘Short-term 4D Trajectory Prediction Using Machine Learning Methods’, Sesar innovation days 2017.
Wilco, R. (2017) Trajectory based operations (TBO). Available at: http://www.roger-wilco.net/do-you-really-understand-–-trajectory-based-operations-tbo/
(Accessed: 2 December 2017).
Williams, E. (2012) Aviation Formulary V1.46.
Xu, Y. and Prats, X. (2017) ‘Including Linear Holding in Air Traffic Flow Management for Flexible Delay Handling’, in Europe Air Traffic Management
Research and Development Seminar.

Conclusion and future research
103
Chapter 9
9. Conclusion and future research
Aligned with the research motivation and objectives initially stated, the main objective of this work is to
enhance the airspace demand-capacity balance by trying to reduce the potential air traffic controller
interventions en-route. Towards this goal, tight interdependencies between aircraft trajectories are
identified at network level and removed by rescheduling take-off times in such a way that target times of
arrival are preserved within a one-minute margin. This can be seen as a short term ATFCM measure that
enables an increase in airspace capacity by reducing the probability to lose separation minima and
transferring the workload of controllers from conflict resolution and manoeuvre communication to traffic
monitoring.
The proposed methodology is based on three modules and has been implemented and tested using realistic
scenarios. Depending on the traffic scenario, 16-52% of the concurrence events are solved without having
to make huge investments but simply by using the provided information and technologies to coordinate the
departures.
The novelty of this efficient departure synchronization methodology that serves as a mitigation mechanism
for concurrence events is that it considers the downstream effects of the applied measures while considering
small departure adjustments, multi-flight levels, speed changes and time uncertainty.
Regarding the proposed research objectives of this doctoral thesis it can be concluded that all objectives
have been reached. The Constraint Programming model that has been implemented generates the
operational constraints for cooperative aircraft departures and the consideration of time uncertainty.
Furthermore, the progress between paper 2 and paper 4 show the improvement of the detection tool and its’ associated neighbourhood analysis. An analysis of trajectory time dependency dynamics was developed
using graph theory to identify coupling and concurrence interdependencies. In a last step, the model was
applied and tested using different realistic traffic scenarios. The outcomes are documented in the selected
research papers.
Finally, by empowering TBO as a flexible synchronization mechanism, several challenges arise and new
research opportunities emerge. During the experiments, it resulted that the amount of traffic is not an
indicator for the number of concurrence events. It might be possible, that the complexity of the traffic and
trajectory interdependencies effect the number of concurrence events. Future research should be dedicated
towards analysing trajectory interdependencies to support the CP solver to find optimal solutions, to
determine the optimal airspace volume and the optimal environment for implementation (i.e. at airports
with a lot of traffic movements) of the tools.
Moreover, further research is required to apply different search strategies on different traffic scenarios
favouring the selection of adjustments close to zero in first term. This way speed adjustment efforts are
expected to be smaller. Also, further research is suggested to understand the cause of saturations and to
develop best strategies on how to solve them.
Finally, it should be analysed towards which extend the application of the tools to a wider airspace including
more operating airports could expand this possibility to mitigate further concurrence events. Also, the look
ahead time for the tools should be analysed to obtain the most optimal solutions and a reasonable time-
uncertainty impact.

Bibliography
104
10. Bibliography
Apt, K. & Wallace, M., 2006. Constraint logic programming using ECLiPSe. Available at:
https://books.google.com/books?hl=de&lr=&id=yyrf6H86_ukC&oi=fnd&pg=PR9&dq=K.+Apt+an
d+M.+Wallace.+“Constraint+Logic+Programming+Using+ECLiPSe”.+Cambridge+University+Pre
ss,+2007&ots=HSV_Dyy5T5&sig=SpbtPPc54EIVrra1CR5dEIfj8U0 [Accessed September 9,
2018].
ATSC113, 2017. UBC ATSC113 crosswinds and headwinds. Available at:
https://www.eoas.ubc.ca/courses/atsc113/flying/met_concepts/02-met_concepts/02d-
crosswind/index.html [Accessed January 29, 2018].
Cook, A., 2007. European air traffic management : principles, practice and research, Available at:
https://books.google.es/books/about/European_Air_Traffic_Management.html?id=vQ9LG6TWl9o
C&redir_esc=y [Accessed May 11, 2017].
Eurocontrol, 2007. HOURLY ENTRY COUNT VERSUS OCCUPANCY COUNT RELATIONSHIP
DEFINITIONS AND INDICATORS (I), Available at:
https://www.eurocontrol.int/sites/default/files/library/015_Hourly_entry_vs_occupancy_count_defi
nitions_and_indicators.pdf.
Eurocontrol, 2018. Minimum Departure Interval - EUROCONTROL ATM Lexicon. Available at:
https://ext.eurocontrol.int/lexicon/index.php/Minimum_Departure_Interval [Accessed May 28,
2018].
Van Hentenryck, P. & Michel, L., 2005. Constraint-based local search, MIT Press.
IBM, 2015. IBM ILOG CPLEX Optimization Studio OPL Language User’s Manual Version 12. IBM, ed.,
ICAO, 2016. Doc 4444. In Procedures for Air Navigation Services Air Traffic Management. Montréal,
Quebec, Canada, pp. 1–464.
ICAO, 2005. International Civil Aviation Organization Global Air Traffic Management Operational
Concept. Available at: https://www.icao.int/Meetings/anconf12/Document
Archive/9854_cons_en[1].pdf [Accessed October 11, 2017].
ICAO, 2015. TBO CONCEPT BY THE ICAO ATMRPP. Available at:
http://www.sesarju.eu/sites/default/files/documents/reports/Appendix_A_to_WP652_TBOCD_3.0.
pdf [Accessed October 12, 2017].
Jefferson, C. et al., Implementing Logical Connectives in Constraint Programming. Available at:
https://pn.host.cs.st-andrews.ac.uk/aij-watchedor-reify-paper.pdf [Accessed April 8, 2017].
N. Tamura, 2018. Cream: Class Library for Constraint Programming in Java. Available at:
http://bach.istc.kobe-u.ac.jp/cream/ [Accessed September 9, 2018].
Netjasov, F., Janić, M. & Tošić, V., 2011. Developing a generic metric of terminal airspace traffic
complexity. Transportmetrica, 7(5), pp.369–394. Available at:
http://www.tandfonline.com/doi/abs/10.1080/18128602.2010.505590 [Accessed May 28, 2018].
Rossi, F., Van Beek, P. & Walsh, T., 2006. Handbook of Constraint Programming. Elsevier.
Schefers, N., González, J.J.R. & Nosedal, J., 2016. An efficient constraint programming model for
cooperative flight departures. In 18th International Conference on Harbor, Maritime and
Multimodal Logistics Modelling and Simulation, HMS 2016.
Sesar, 2015. THE ROADMAP FOR DELIVERING HIGH PERFORMING AVIATION FOR EUROPE
European ATM Master Plan. , Edition 20, p.126.
SESAR, 2017. SESAR Joint Undertaking | High performing aviation for Europe. Available at:
https://www.sesarju.eu/ [Accessed May 28, 2018].
SESAR JU, 2012. SESAR Concept of Operations Step 1. Available at:
http://www.sesarju.eu/sites/default/files/documents/highlight/SESAR_ConOps_Document_Step_1.
pdf [Accessed October 12, 2017].

Bibliography
105
SKYbrary, 2017. 4D Trajectory Concept - SKYbrary Aviation Safety. Available at:
https://www.skybrary.aero/index.php/4D_Trajectory_Concept [Accessed November 19, 2017].
Tselios, D.C., Savvas, I.K. & Kechadi, M.T., 2013. Multiple project portfolio scheduling using recurrent
neural networks. International Journal of Simulation and Process Modelling, 8(4), p.227.

Bibliography
106

Appendix
107
A. Appendix
Paper 5
The main focus of this paper lays in the analysis of the possible benefits of such a STAM procedure by
applying the methodology to a high traffic density control sector located in the London Terminal
Manoeuvring Area. Following this approach, it will be possible to give recommendations about the most
efficient parameters for the algorithm: cell-size, look-ahead time and number of airports in operation. This
novel concept tested on a realistic scenario allows to reduce the number of potential ATC interventions in
an efficient manner.

STAM-based methodology to prevent concurrence
events in a Multi-Airport System (MAS)
Nina Schefers(1), Manuel Angel Amaro Carmona(2)
Juan José Ramos González (3), Francisco Saez Nieto (4), Pau Folch (5)
(1)(3) Technical Innovation Cluster on Aeronautical Management, Universitat Autónoma de Barcelona, Sabadell (Barcelona), Spain.
(e-mail: [email protected]), (e-mail: [email protected]) (2)(4)
School of Aerospace Transport and Manufacturing (SATM), Cranfield University, Cranfield (Bedfordshire), United Kingdom.
(e-mail: [email protected]), (e-email: [email protected]) (5)
Department of Research and Innovation, Aslogic, Rubí, Spain
(e-mail: [email protected])
Abstract— Pre-tactically managing the imbalances of the network and organize the resources of the airspace is one of the main
objectives of Dynamic Demand & Capacity balancing. Introducing Short-term Air Traffic Flow and Capacity Management
measures such as minor ground delays or slight speed adjustments applied to a selected number of flights on the day of
operations, supports the Dynamic Demand & Capacity balancing by reducing the traffic complexity and the probability of Air
Traffic Controllers interventions. The collaborative decision-making process underlies this concept by discussing the optimal
decision for processes. This paper introduces a consecutive methodology for detecting concurrence events, analysing their
trajectory interdependencies and applying a mitigation measure to apply a strategic shifting of Estimated Take-Off Time
(ETOT) within their Calculated Take-Off Time (CTOT) windows. The main focus of this paper lays in the analysis of the
possible benefits of such a STAM procedure by applying the methodology to a high traffic density control sector located in the
London Terminal Manoeuvring Area. Following this approach, it will be possible to give recommendations about the most
efficient parameters for the algorithm: cell-size, look-ahead time and number of airports in operation. This novel concept tested
on a realistic scenario allows to reduce the number of potential ATC interventions in an efficient manner.
Keywords— Short-Term ATFCM Measures (STAM), Dynamic Demand & Capacity Balancing (dDCB), Trajectory Interdependencies,
Trajectory Based Operations (TBO), Air Traffic Management, Decision Support Tool, Graph Theory, Concurrence event detection and
resolution, London Terminal Manoevring Area.
1. INTRODUCTION
The growth of passenger traffic observed in the last 20 years (UK Department for Transport 2013) generated a forthcoming
necessity to increase the airspace and airport capacity. The eventual distribution of the population around large cities and the
capacity constraints on existing major airports led to build new airports and introduce the concept of Multi-Airport Systems (MAS)
as a key mechanism to meet the future demand.
The European and US Air Traffic Management (ATM) systems are expected to be modernized based on the research and
development activities coordinated by the Single European Sky ATM Research (SESAR) and the Next Generation Air
Transportation System (NextGen) programmes (Sesar JU 2017; Next Gen Program 2017), respectively. The Trajectory-Based
Operations (TBO) concept, in which the airspace user’s (AU’s) intentions are shared to all the interested parties, is the base of
many proposed solutions. Regarding the Air Traffic Flow and Capacity Management (ATFCM) process, SESAR defined the Short-
Term ATFCM Measures (STAM) as a mechanism that helps to improve the Demand and Capacity Balancing (DCB) activities by
applying a set of pre-tactical measures few minutes before the departure time (Sesar JU 2017; Nosedal et al. 2014). STAM measures
could target to the flight plan (e.g. re-routing, speed changes, delay departure or slot swapping) or to the airspace (e.g. use of some
military areas, level-capping, sector re-configuration).
This paper presents a STAM-based methodology to reduce the probability of the number of Air Traffic Controller (ATC)
interventions “on air” and the of loss of separation minima infringement in surrounding areas of the airports. The method proposes
the application of minor changes in the Estimated Take-Off Time (ETOT) (within the -5/+10 minutes window defined by the
Calculated Take-Off Time (CTOT)). Although, the concept could be used for en-route scenarios, in this study, it has been adopted
to MAS. The terminal control areas are stablished in the vicinities of the airports and conform the junction between the control
zones and the airways. The control area of a multi-airport system is characterized by recurrent traffic that is distributed among the
different airports of the zone. Short-term air traffic demand is stablished based on expected traffic crossing each ATC sector.
Applying minor changes to the take-off time of selected flights is useful in a MAS for several reasons. Firstly, the mixed outbound
traffic from different airports comprises the main sources of interdependencies that increase the traffic complexity and the ATC

workload. Secondly, the traffic is more predictable for terminal airspace operations, which reduces the uncertainty levels and
improve the flexibility of the measures.
The presented methodology is composed by three main functionalities: detection, analysis, mitigation that are sensible to different
parameters. Consequently, the research goal is to apply the STAM solution in a Terminal Manoeuvring Area (TMA) and
understand the operating parameters of the methodology that are suitable to be applied for a specific MAS. To this end, a set of
tools have been developed using the method and a set of simulation exercises have been designed to analyse and study suitable
working conditions for the proposed methodology.
The improvement of the pre-departure sequence must be seamlessly introduced at airport level without disturbing controllers’ strategy using collaborative procedures. This paper analyses the possible benefits of such a STAM procedure by applying the
methodology to a high traffic density control sector (EGTTCAP) located into the London Terminal Manoeuvring Area (LTMA).
The paper is organized as follow: After a brief literature review in Chapter 1.1, a description of the mapping, detection, analysis
and mitigation methodology is given in section 2. The operational context and case of study are detailed in section 3 and the
obtained experimental results are discussed. Finally, section 4 provides the conclusions and future research possibilities.
1.1 State of the Art
Historically, the ATFCM activities have been based on metrics estimated at strategic level such as the entry-count, and more
recently, the occupancy (Eurocontrol 2007). The number of aircraft that can be handled by the ATCs is limited by their workload.
When the maximum capacity is about to be reached, the air traffic demand is limited by applying regulations to all the aircraft of
the sector. Regulations produce delays or re-routings and have a direct impact on the environment and in the airlines strategy. From
the ATM point of view, these measures are effective, because limiting the demand releases the system, but not efficient enough
because it affects all the agents of the system. The results of limiting the demand is an eventual over-release of the airspace that
reflects that the measures taken to avoid a likely high-demand situation were not based on a good prediction of the system. The
current metrics do not provide enough detail to determine the effects of the expected demand in the ATCs workload. At this point,
the DCB process requires more realistic ways to determine how an increase of the demand in a sector affects the number of ATC
interventions, i.e. using machine learning and big data technologies to improve the forecasts or introducing the use of complexity
metrics in the regulation process.
Complexity metrics have been studied since many years by different authors (Netjasov et al. 2011). Additionally, Air Navigation
Service Providers (ANSP) could calculate their own complexity metrics to reconfigure the airspace according to the required
capacity or to support the decision-makers to impose local restrictions, such as Minimum Departure Intervals (MDI) (Eurocontrol
2018b). The effects of these measures tend to be efficient in areas where many airports feed a high number of aircraft to a common
sector (e.g. London TMA). Although the MDI could be considered a more dynamic process, the principle is based in limiting the
demand of selected Standard Instrumental Departures (SID). Consequently, equally-distributed ground delays (e.g. “one each ten
minutes”) are applied to all the flights that use the affected SIDs. To determine the required interval, the measure groups the
affected flights by SID and its purpose is limiting the entry-count/occupancy to the target sector like performed at strategic level
during the DCB process. The process does not identify what are the actual effects of selected flights in the target sector nor in the
ATC workload.
The methodology presented is supported by the calculation of more dynamic metrics based on short-term trajectory predictions
that identifies the effects of each AU as a stand-alone element of the system. This process determines the effects of individual AUs
in the number of ATC interventions by detecting the imminent and potential concurrence events of each flight that crosses the
target volume. Then, it is proposed a small changes of the Estimated Take-Off Time (ETOT) of selected flights in order to reduce
the probability of ATC interventions.
2. METHODOLOGY DESCRIPTION
This section defines the methodology used to implement the consecutive set of tools. From a modular decomposition point of view,
the main functional areas are detection, analysis and mitigation.
The detection functionality identifies the concurrence events and it is split into two sub-modules: the mapping process and the
filtering process. The analysis functionality refers to the identification of topologies of interdependencies that cannot be removed
by ground delays constrained by the CTOT time-window. This analysis will be helpful for identifying the trajectories that should
be removed from the problem formulation in the mitigation functionality to provide a robust departure coordination. The mitigation
functionality calculates feasible time stamp domains considering multi-objective criteria to resolve the trajectory clusters. The
modular structure proposed for the development of the tools and their associated algorithms is shown in Figure 1.

Figure 1: Modular structure of the tool
2.1 Detection Methodology
The mapping process includes on one hand the mapping of the trajectories onto a grid of cells covering the determined airspace
and the spatio-temporal (S-T) interdependencies to identify potential concurrence events between trajectories that lose their safety
buffer. The benefits of this methodology are the efficient way of identifying CE by partitioning the airspace and therefore being
capable to promptly identify CE.
2.1.1 Mapping Process
To detect concurrence events, the airspace is partitioned into square cells with a size related to the lateral separation minima. The
cell size is a parameter that depends on the operational environment (e.g. Terminal Manoeuvring Area or en-route). In this work,
different operational parameters are tested to understand the behaviour of the tools and the correlation to the detected CE. 4D
trajectories provide the benefit that the aircraft can fly on a practically unrestricted trajectory for as long as possible in exchange
of being obliged to meet accurately any arrival time over a designated point (SKYbrary 2017).. To ensure the reliability of the
concurrence event identification, the traffic in the surrounding cells is analysed using an intelligent neighbourhood check algorithm.
After the initial mapping, cells that have an occupancy rate equal or greater than two aircraft simultaneously and/or neighbouring
cells where two or more aircraft lose separation minima are identified, and stored in a matrix.
The second step of the mapping process is to process the entry and exit times of each aircraft trajectory into the cells, see Figure
2. With this information, the calculation of the temporal looseness (“clearance time” or “overlap time”) between pairs of aircrafts
using the same cell can be determined. “Clearance time” refers to any time in which two aircraft do not share a cell. Logically, the
smallest “clearance time” would be that one aircraft is just about to leave the cell and another aircraft is about to enter the cell. The
temporal looseness of two aircraft can be calculated by determining the minimum value of the exit time of the two aircraft and
subtract the maximum entry time from this value ℎ .
Where ℎ = [�� − � ] ∗ 6 measured in seconds and where represents the temporal looseness of a clearance and >
represents an overlap.
ℎ (1)
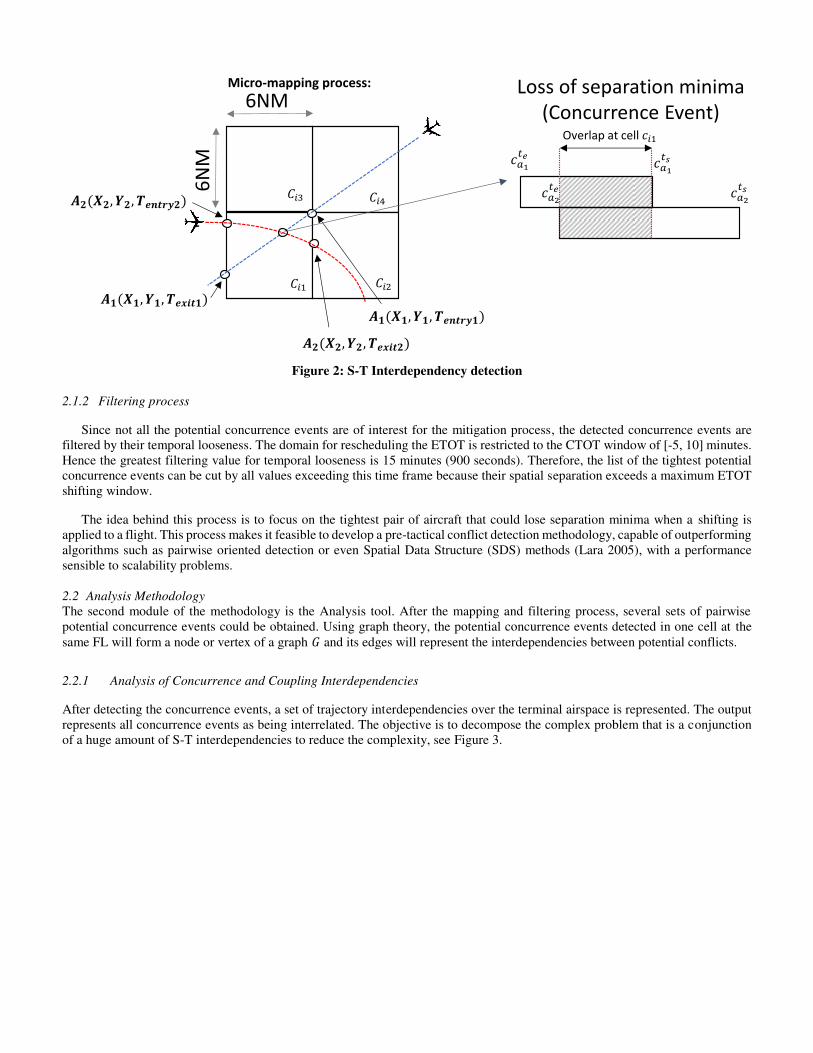
Figure 2: S-T Interdependency detection
2.1.2 Filtering process
Since not all the potential concurrence events are of interest for the mitigation process, the detected concurrence events are
filtered by their temporal looseness. The domain for rescheduling the ETOT is restricted to the CTOT window of [-5, 10] minutes.
Hence the greatest filtering value for temporal looseness is 15 minutes (900 seconds). Therefore, the list of the tightest potential
concurrence events can be cut by all values exceeding this time frame because their spatial separation exceeds a maximum ETOT
shifting window.
The idea behind this process is to focus on the tightest pair of aircraft that could lose separation minima when a shifting is
applied to a flight. This process makes it feasible to develop a pre-tactical conflict detection methodology, capable of outperforming
algorithms such as pairwise oriented detection or even Spatial Data Structure (SDS) methods (Lara 2005), with a performance
sensible to scalability problems.
2.2 Analysis Methodology
The second module of the methodology is the Analysis tool. After the mapping and filtering process, several sets of pairwise
potential concurrence events could be obtained. Using graph theory, the potential concurrence events detected in one cell at the
same FL will form a node or vertex of a graph and its edges will represent the interdependencies between potential conflicts.
2.2.1 Analysis of Concurrence and Coupling Interdependencies
After detecting the concurrence events, a set of trajectory interdependencies over the terminal airspace is represented. The output
represents all concurrence events as being interrelated. The objective is to decompose the complex problem that is a conjunction
of a huge amount of S-T interdependencies to reduce the complexity, see Figure 3.
Micro-mapping process:
Overlap at cell
Loss of separation minima
(Concurrence Event)
6N
M
6NM
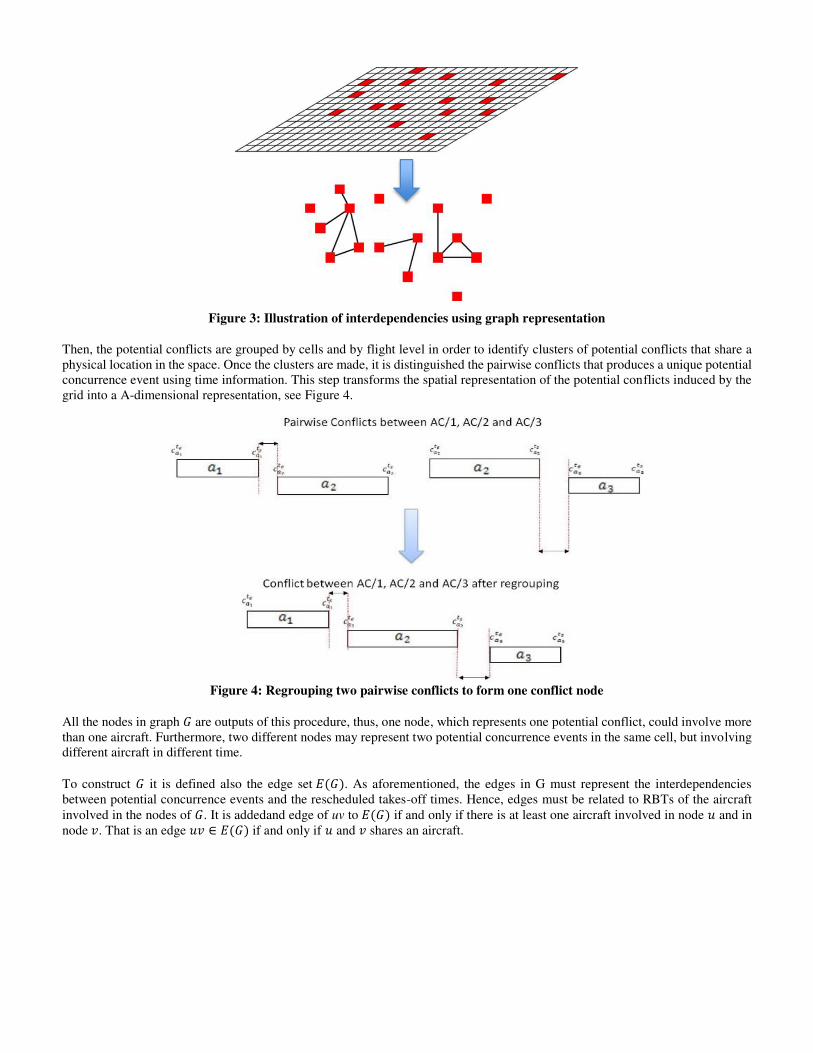
Figure 3: Illustration of interdependencies using graph representation
Then, the potential conflicts are grouped by cells and by flight level in order to identify clusters of potential conflicts that share a
physical location in the space. Once the clusters are made, it is distinguished the pairwise conflicts that produces a unique potential
concurrence event using time information. This step transforms the spatial representation of the potential conflicts induced by the
grid into a A-dimensional representation, see Figure 4.
Figure 4: Regrouping two pairwise conflicts to form one conflict node
All the nodes in graph are outputs of this procedure, thus, one node, which represents one potential conflict, could involve more
than one aircraft. Furthermore, two different nodes may represent two potential concurrence events in the same cell, but involving
different aircraft in different time.
To construct it is defined also the edge set . As aforementioned, the edges in G must represent the interdependencies
between potential concurrence events and the rescheduled takes-off times. Hence, edges must be related to RBTs of the aircraft
involved in the nodes of . It is addedand edge of uv to if and only if there is at least one aircraft involved in node and in
node . That is an edge ∈ if and only if and shares an aircraft.

Figure 5: Two potential conflicts shearing aircraft 1
Figure 5 shows two potential concurrence events that occur in different cells. Let be the node of G that represents the potential
conflict listed in cell � and the node for the conflict in � . Then, it is added the edge uv to because and share Aircraft
1.
The problem is represented by taking advantage of the adjacency list and the adjacency matrix. For the traversal graph, also known
as graph search, the Depth-First Search (DFS) algorithm is used. By formulating the problem using graph theory, the whole
function can be decomposed to find a set of disconnected graphs that form independent clusters, as shown in Figure 6.
Figure 6: Independent clusters
Moreover, graph representation allows identifying concurrence and coupling interdependencies. Concurrence interdependencies
are those which appear between aircraft that are in the same node in , see Figure 7.

Figure 7: Concurrence interdependencies
If there exist in a -path between two nodes and each one encoding a potential conflict, then there is a coupling
interdependence between them, see Figure 8.
Figure 8: Coupling Interdependencies
The introduction of coupling and concurrence interdependencies allows it to define metrics to understand when an aircraft should
be delegated or eliminated of the solution space.
Finally, when rescheduling take-off times, the potential concurrence event encoded in may result in a reduction of the clearance
in by modifying the CTOT of Aircraft 1 and vice-versa. In cases where and represent potential conflicts with a positive
clearance in both cases, a rescheduling take-off in Aircraft 1 may remove one potential conflict but, produce at same time a real
conflict later on. The formulation based on graph theory allows to represent real conflicts and their interdependencies and to
visualize the complex structures.
Once the interdependent clusters are detected, the mitigation tool based on constraint programming can be supported. By
partitioning the problem size, better computational performance and the reduction of the probability of ATC interventions due to
greater clearance times could be achieved, which directly enhances the airspace demand-capacity balance.
2.3 Mitigation Methodology
The mitigation algorithm shall be formulated as an optimization problem where the constraints are formulated to remove the tight
interdependencies (H>0). The mitigation tool is based on the following modelling structures.
set of aircraft
set of cells that have a concurrence event
set of Flight Levels
�� = {< �, �, > | ∀� ∈ , ∀� ∈ , ∀ ∈ }
(2) = { }, = . . � (3)
d.v. � ∈ [−� , � ], ∀� ∈ (4)
d.v. � : � = � � + � − � + , ∀� ∈ �� (5)
d.v. = { � |� ∈ ��} , ∀� ∈ , ∀ ∈ (6)
d.v. = [ , (7)
d.v. = [s( ), ( ) , ∀� ∈ , ∀ ∈ , ∀ ∈ . . � : (8)
( ) ∈ [ ( ) − �( ), ( ) + �( )]
d.v. = { | ∀� ∈ , ∀ ∈ , ∈ . . � } (9)
A1
A2 A4
C1C1 =
C1 C2 C3
C1, C2, C3 =
A1
Minimize:
∑|� |= + ∑ �= (10)
subject to:
� = � + ± � (11)
∀ , ∈ (12)
⟺ � < � ⇒ = ± � (13) ∈ [ − , + ] (14)
� ( , { }), ∀� ∈ , ∀ ∈ (15)
∀� ∈ , ∀ ∈ , ∀ , ∈ . . �
⇔ � < � ⇒ (16)
( ) , ∀ , : < (17)
( ) = , ∀ , : = + (18)
{ ( ) = �( ) = � ⇔ �� = �� �� = � , ∀� ∈ ���
(19)
�ℎ [ ], { } , ∀ ∈ (20)
The CP model data structure defines a set of aircraft and a set of concurrence event cells at a given flight level .
The decision variables ensure that the departure adjustment of the aircraft remains in the defined timeframe of [-5,10] minutes
(equation 4); the interval for the occupancy of the cell � by an aircraft � at a given FL with its size and start and end time
(equation 5); each of the cells can be occupied by one aircraft at a certain FL at a time, so the aircraft going through the cell must
be sequenced accordingly (equation 6); the representation of the entire flight trajectory where will be the take-off time and
the arrival time in the solution (equation 7); the interval variables representing the segments of the and their size (equation 8);
and the sequence variable is introduced to set the relationship between the trajectory segments and the entire trajectory
(equation 9).
The bi-objective optimization goal that combines the aspects (minimizing the total aircraft delays) and (binding the Target
Time (TT); where � refers to the aircraft, � is the delay applied and � represents the minimization of all RBT segments
according to their allowed elasticity if the TT cannot be met), see equation 10.
The first constraint aims to model the shifting of every interval variable � according to the applied delay and its time-uncertainty
(equation 11). Furthermore, all aircraft in a cell � with proximate events should have no overlap (equation 12). The interval variable
which represents the duration of the flight is determined by the constraint of the take-off time (equation 13) and the time of
arrival (equation 14). Furthermore, the relationship between the flight interval variable and its segments is modelled by the
following span condition to ensure the completeness of the trajectory (equation 15). The constraint span states that the interval
flight spans over all present intervals from the set segments. That is, interval flight starts together with the first present segment
interval and ends together with the last one. To ensure this, the no overlap constraint (equation 16) ensures that interval variables
to not overlap each other. In this case, the individual Reference Business Trajectory (RBT) segments should have no overlap. Also,
the constraint is added that ensures that one segment has to start before the next (equation 17) and that the start of segment takes
place after the end of segment (equation 18). Equation 20 is used to link the interval variable � that is used in combination
with the sequence variable to remove the concurrence events at cell �, with the concurrence segments of the trajectory , since
they are representing the same time windows. Finally, (equation 20) synchronizes the trajectory segments of different FLs to model
the 3D concurrence event mitigation. (Schefers et al. 2016)
3 APPLICATION AND EXPERIMENTAL RESULTS
The developed methodology has been applied to a testing case. First, it is shown the operational environment and operational
context considered for the experiments. Secondly, the testing case framework is outlined. Lastly, the section presents and discuss
the obtained results.
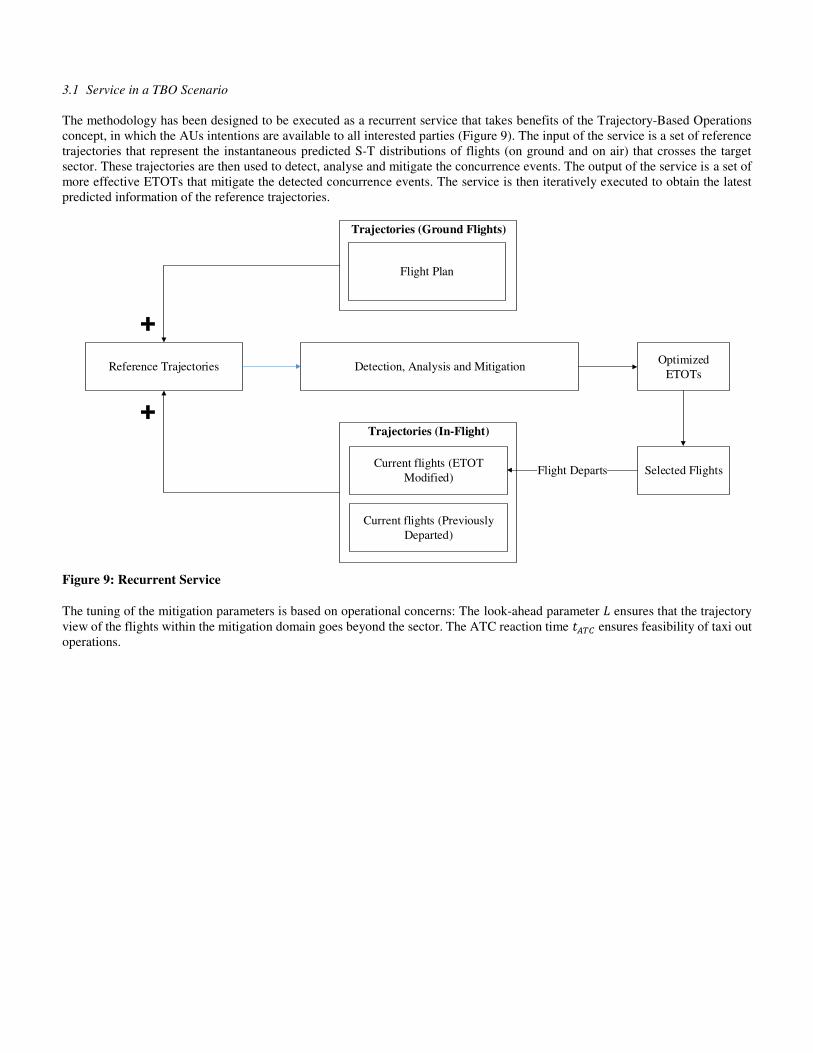
3.1 Service in a TBO Scenario
The methodology has been designed to be executed as a recurrent service that takes benefits of the Trajectory-Based Operations
concept, in which the AUs intentions are available to all interested parties (Figure 9). The input of the service is a set of reference
trajectories that represent the instantaneous predicted S-T distributions of flights (on ground and on air) that crosses the target
sector. These trajectories are then used to detect, analyse and mitigate the concurrence events. The output of the service is a set of
more effective ETOTs that mitigate the detected concurrence events. The service is then iteratively executed to obtain the latest
predicted information of the reference trajectories.
Trajectories (In-Flight)
Trajectories (Ground Flights)
Detection, Analysis and Mitigation
Flight Plan
Current flights (ETOT
Modified)Selected FlightsFlight Departs
Current flights (Previously
Departed)
Optimized
ETOTsReference Trajectories
Figure 9: Recurrent Service
The tuning of the mitigation parameters is based on operational concerns: The look-ahead parameter � ensures that the trajectory
view of the flights within the mitigation domain goes beyond the sector. The ATC reaction time ��� ensures feasibility of taxi out
operations.
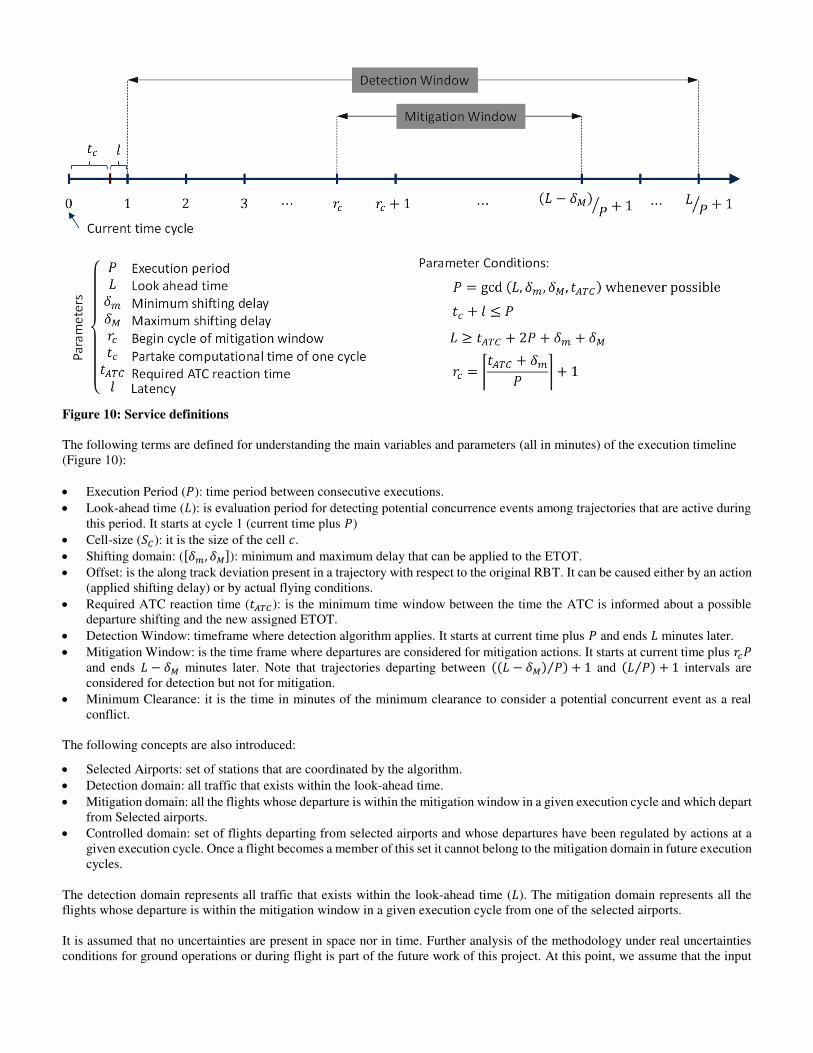
Figure 10: Service definitions
The following terms are defined for understanding the main variables and parameters (all in minutes) of the execution timeline
(Figure 10):
Execution Period ( ): time period between consecutive executions.
Look-ahead time (�): is evaluation period for detecting potential concurrence events among trajectories that are active during
this period. It starts at cycle 1 (current time plus )
Cell-size ( �): it is the size of the cell �.
Shifting domain: ([� , ��]): minimum and maximum delay that can be applied to the ETOT.
Offset: is the along track deviation present in a trajectory with respect to the original RBT. It can be caused either by an action
(applied shifting delay) or by actual flying conditions.
Required ATC reaction time ( ���): is the minimum time window between the time the ATC is informed about a possible
departure shifting and the new assigned ETOT.
Detection Window: timeframe where detection algorithm applies. It starts at current time plus and ends � minutes later.
Mitigation Window: is the time frame where departures are considered for mitigation actions. It starts at current time plus
and ends � − �� minutes later. Note that trajectories departing between � − �� ⁄ + and �⁄ + intervals are
considered for detection but not for mitigation.
Minimum Clearance: it is the time in minutes of the minimum clearance to consider a potential concurrent event as a real
conflict.
The following concepts are also introduced:
Selected Airports: set of stations that are coordinated by the algorithm.
Detection domain: all traffic that exists within the look-ahead time.
Mitigation domain: all the flights whose departure is within the mitigation window in a given execution cycle and which depart
from Selected airports.
Controlled domain: set of flights departing from selected airports and whose departures have been regulated by actions at a
given execution cycle. Once a flight becomes a member of this set it cannot belong to the mitigation domain in future execution
cycles.
The detection domain represents all traffic that exists within the look-ahead time (�). The mitigation domain represents all the
flights whose departure is within the mitigation window in a given execution cycle from one of the selected airports.
It is assumed that no uncertainties are present in space nor in time. Further analysis of the methodology under real uncertainties
conditions for ground operations or during flight is part of the future work of this project. At this point, we assume that the input
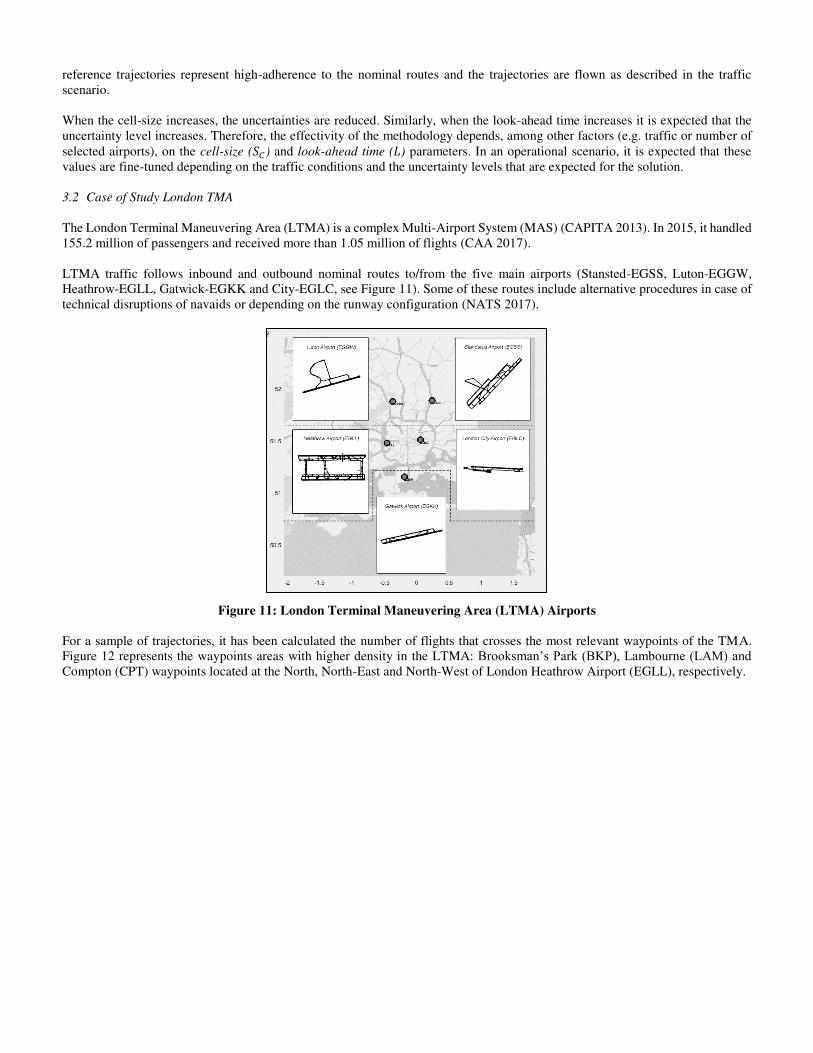
reference trajectories represent high-adherence to the nominal routes and the trajectories are flown as described in the traffic
scenario.
When the cell-size increases, the uncertainties are reduced. Similarly, when the look-ahead time increases it is expected that the
uncertainty level increases. Therefore, the effectivity of the methodology depends, among other factors (e.g. traffic or number of
selected airports), on the cell-size ( �) and look-ahead time (�) parameters. In an operational scenario, it is expected that these
values are fine-tuned depending on the traffic conditions and the uncertainty levels that are expected for the solution.
3.2 Case of Study London TMA
The London Terminal Maneuvering Area (LTMA) is a complex Multi-Airport System (MAS) (CAPITA 2013). In 2015, it handled
155.2 million of passengers and received more than 1.05 million of flights (CAA 2017).
LTMA traffic follows inbound and outbound nominal routes to/from the five main airports (Stansted-EGSS, Luton-EGGW,
Heathrow-EGLL, Gatwick-EGKK and City-EGLC, see Figure 11). Some of these routes include alternative procedures in case of
technical disruptions of navaids or depending on the runway configuration (NATS 2017).
Figure 11: London Terminal Maneuvering Area (LTMA) Airports
For a sample of trajectories, it has been calculated the number of flights that crosses the most relevant waypoints of the TMA.
Figure 12 represents the waypoints areas with higher density in the LTMA: Brooksman’s Park (BKP), Lambourne (LAM) and Compton (CPT) waypoints located at the North, North-East and North-West of London Heathrow Airport (EGLL), respectively.

Figure 12: High-density areas in London terminal airspace (data adopted from Eurocontrol DDR2 (Eurocontrol 2017))
The Capital sector (EGTTCAP), represents an often-regulated area of the London TMA. EGTTCAP is the result of band boxing
the elementary volumes Compton (EGTTCPT) and Vaton (EGTTVAT). Figure 13 shows the hourly demand distribution of
EGTTCAP. Regulations highlighted in red have been triggered in EGTTCPT.
Figure 13: Regulations in Capital (EGTTCAP) during summer 2016 (Eurocontrol 2018a)
Departure from the LTMA is often limited by the so called Minimum Departure Intervals (MDI). The application of MDI rules
involves that target airports (e.g. Stansted or Birmingham) are required to limit successive take-offs for a specific interval of time
on the same SID (e.g. one flight each ten minutes). The rule aims at regulating the number of aircraft on air due to an unexpected
increase on the entry-count of highly congested sectors. The problems associated to these rules is that their application targets all
the departures on the same SID. This effect produces that some flights in the departure queue could be affected but they do not
cross the congested volumes.
The idea of using the methodology is to determine a more efficient and logical departure sequence, targeting only the flights that
could produce concurrence events, resulting in a more favorable demand distribution in the congested sectors. The ultimate goal
is then reducing the number of ATC interventions in the air helping to maintain the LTMA airports throughput.
The algorithm presented in this paper was applied as a service to different realistic traffic samples obtained from Eurocontrol
Demand Data Repository (DDR2) (Eurocontrol 2018a). Data provides a very accurate picture of pan-European air traffic demand,
from several years ahead until the day before operations. It can be used to support the network collaborative planning process that
include strategic, seasonal and pre-tactical planning as well as for the planning of special events or major ATM evolution projects.

Simulation exercises have been designed using the full LTMA volume (EGTTTC) to analyze and study optimal working conditions
for the proposed methodology. Firstly, a traffic scenario was selected to analyze the three most relevant parameters: cell size,
number of airports in operation and look-ahead time. Once the appropriate operating parameters from this scenario are identified,
they are applied to other days/times of traffic.
To test and evaluate the method towards the most relevant operating parameters, a variety of experiments using the developed
framework were tested in a fast simulation exercise, see Table 1. The simulation reflects upon the output of each module which is:
• Detection: number of potential concurrence events that could be removed.
• Analysis: number of clusters within the mitigation window
• Mitigation: number of removed potential concurrence events in the cycle together with the number of applied shifting.
The experiments 1-10 test the influence of the cell size towards the percentage of CE that can be mitigated using the proposed
methodology. The cell size ( �) ranges from 2NM to 6NM. Also, the impact of implementing the methodology in 2 or in 4 operating
airports that supply the LTMA was analyzed. We have chosen a 2-airport and 4-airport experiment setup based on preliminary
observations of the traffic. The two main airports that feed traffic to the EGTTCAP sector are London Luton (EGGW) and London
Stansted (EGSS). Additionally, Birmingham (EGGD) and Bristol (EGBB) airports feed an important amount of traffic to
EGTTCPT. Experiments 11-16 analyze the look-ahead time, considering the service definitions as explained in Figure 10.
Furthermore, an analysis of the variability of the entry-count with respect to the cell size and an analysis of the relationship between
the occupancy and the CE was performed to obtain information at an aggregated level regarding the system’s sensitivity to network
dynamics.
Cell Size Airports Look-Ahead Time (�)
Experiment 2NM 3NM 4NM 5NM 6NM 2 4 45 60 75
1 ✔ ✔ ✔
2 ✔ ✔ ✔
3 ✔ ✔ ✔
4 ✔ ✔ ✔
5 ✔ ✔ ✔
6 ✔ ✔ ✔
7 ✔ ✔ ✔
8 ✔ ✔ ✔
9 ✔ ✔ ✔
10 ✔ ✔ ✔
11 ✔ ✔ ✔
12 ✔ ✔ ✔
13 ✔ ✔ ✔
14 ✔ ✔ ✔
15 ✔ ✔ ✔
16 ✔ ✔ ✔
Table 1: Performed experiments to demonstrate the behavior of the methodology according to identified parameters
The parameters used in the fast simulation consider a rolling horizon with a cycle repetition ( ) of every 5 minutes, a required
ATC reaction time ( ���) of 10 minutes, and the mitigation CTOT window of [-5, 10] minutes.
3.3 Experimental results
As an initial step, a traffic scenario was selected to perform the fast simulation and to provide recommendations about the most
relevant operating parameters: cell size, number of operating airports and look-ahead time. It was used a sample traffic data of 19th
of July 2017 from 6am to 7am. LTMA has been the target of an important number of regulations during summer of 2017 (including
the 19th of July 2017), and most regulations occurred in the traffic peak period between 6:00am and 7:00am (Eurocontrol 2017).

The experiments mentioned above in Table 1 are performed to understand the systems behaviour with respect to the most relevant
operating parameters. Later, these findings are compared and applied to other traffic scenarios to consolidate the results and
generate a benchmark.
A graphical visualisation of the trajectories of chosen scenario is shown in Figure 14. The red lines indicated trajectories with CEs
whereas the green lines indicate a CE-free trajectory during the indicated timeframe. The white geometric shapes surrounding the
London area show the extent of the LTMA.
Figure 14: Visualization of the RBTs of the selected traffic scenario
In the selected scenario, an average of 16% of CE belongs to the solution space of the algorithm (in the following indicated as
PCEs), meaning that the trajectories are flights that are still on the ground, belongs to one of the airports that are considered and
therefore can be time-shifted by the mitigation process. The percentage in Figure 15 indicates that for this traffic scenario the
algorithm could apply mitigation rules in 16% of the traffic (at maximum) in order to reduce the amount of potential ATC tactical
interventions on air.
Figure 15: Percentage of overall detected CEs and those that belong to the algorithms solution space (PCEs)
Figure 16 presents the amount of PCEs and CEs that have been detected. With an increased cell size, the number of CEs and PCEs
increase because more aircraft share a cell and therefore more flights are considered CEs. The amount of PCEs is directly
proportional to the number of selected airports where the mitigation process is applied. The 84% of concurrence events that does
not belong to the algorithm solution space are produced by flights that departed from airports outside of the London area.
84%
16%
Percentage of solvable CEs
All detected CEs
CE that belong to the algorithms solution space (PCE)

Figure 16: Total detected CE and PCEs according to the applied cell size
The most remarkable result to emerge from the analysis of the cell size (experiments 1-10, Table 1) is that the percentage of solved
PCEs and the absolute number of solved PCEs is maximum for cell size of 2 and 3 NM. Starting from a cell size of 4NM, the
solvability decreases significantly as show in Figure 17. Since LTMA is a very dense area with a high volume of traffic and many
S-T interdependencies exist, there are cases when there is not enough capacity in the temporal dimension to change the ETOT
without producing downstream effects. However, the number of CEs that cannot be solved during mitigation is very low using a
cell size of 2 or 3 NM (Figure 17). The percentage of solved PCEs reaches almost 90% with a cell size of 2NM and 75% with a
cell size of 3NM (grey line). Furthermore, when looking at the absolute numbers of PCEs that have been solved (orange bar), the
highest number of PCEs are solved applying a cell size of 2NM (15 CEs) and 3NM (18 CEs). This result furthermore shows that
the percentage of overall solvable CEs (green bar) increases with a bigger cell size until it achieves a saturation level at which no
more concurrence events are detected.
Figure 17: Analysis of the cell size. The red bar indicates the amount of CE that can be considered by the algorithm (PCE).
The green bar indicates the amount of PCE that could not be removed. The grey line shows the percentage of solved PCEs
with respect to all PCEs and the orange bar shows the mitigated PCEs n absolute numbers.
17 24 45 78 8687
195
284
466
610
2 3 4 5 6
PC
E/C
E
CELL SIZE
TOTAL DETECTED CE VS . CE THAT BELONG TO THE
ALGORITHMS S OLUTION S PACE (PCE)
CE that belong to the algorithms solution space (PCE) All detected CEs
0%
10%
20%
30%
40%
50%
60%
70%
80%
90%
100%
0
10
20
30
40
50
60
70
80
90
2 3 4 5 6
Analysis: Cell Size
CE that belong to the algorithms solution space (PCE) PCE that remain after mitigation
PCE mitigated in absolute numbers % of solved PCE vs. All PCE

Furthermore, to obtain information at an aggregated level regarding the system’s sensitivity to network dynamics, an analysis of
the effect of the cell size on the occupancy has been performed. As it can be seen in Figure 18, all three parameters, entry-count,
exit-count and occupancy remain almost constant while the cell size increases. The constant values throughout the different cell
size is an indicator that all trajectories are detected independent of the cell size is.
Figure 18: Occupancy vs. Cell Size. It can be seen that the entry and exit counts and the occupancy remain stable with an
increasing amount of CE.
The second parameter to analyze is the number of operating airports. The number of CE using either 2 (EGGW and EGSS) or
4 airports (EGGW, EGSS, EGBB and EGGD) seems not to influence significantly on the mitigation possibilities for small cell
sizes. When the cell size increases, the difference between 2 or 4 operational airports increases and in the case of 6NM, 17 more
CE could be solved, see Figure 19. The reason for this is that for the sample of the experiment, EGGW and EGSS provide higher
traffic volume than EGBB/EGGD.
0
100
200
300
400
500
600
2 3 4 5 6
Co
unts
Cell Size
Occupancy vs. Cell Size
exit count entry count average occupancy Amount of total CE

Figure 19: Comparison of CEs with 2 operating airports and 4 operating airports
The third important operating parameter that has been analysed in the look-ahead time (experiments 11-16, Table 1). For these
experiments, a series of different look-ahead times were tested to understand their influence on the amount of concurrence events.
It is assumed that the possibility of CEs is lower with a smaller look-ahead time and grows as we increase it until a saturation level
is reached. On one hand, with a very small look-ahead time the effectiveness of the method to solve CEs is very small and on the
other hand, a big look-ahead time causes an increase of the uncertainty. Therefore, the analyses should reveal which look-ahead
time has the best trade-off between effectiveness in solving CEs and uncertainty.
The smallest look-ahead time that has been chosen is 45 minutes. As explained Figure 10, there are various parameters to determine
the look-ahead time. The look-ahead time is the time that trajectories are predicted in advance. Usually, this time is calculated
according to the average time of an aircraft inside the TMA, which in this case is around 20 minutes. The ATC time is the time, the
ATC need to react to provide the ETOT without being affected by ground operations. This parameter depends on different factors
such as the skills of the ATC to match the proposed ETOT, the airport layout and/or the airport traffic/demand.
Finally, the execution time is the time needed to execute the algorithm. In this case, the execution time is multiplied by two (2),
first to execute the algorithm and second to take into consideration the latency to submit the solution to the ATC. Therefore, for
this simulation configuration the smallest look-ahead parameter is 20 min. (look-ahead time) + 15 min. (ATC time) + 5 min + 5
min (execution time) = 45 min. Note that the uncertainty associated to the first 15 minutes is expected to be absorbed at tactical
level by the ATC capabilities to take-off the aircraft on the proposed ETOT. A sensitivity analysis is required to estimate the take-
off time accuracy required to tackle the uncertainties associated to the trajectory until intercepting the concurrence event zone.
The test revealed that there was a correlation between the look-ahead time parameter, the cell size and the execution time of the
algorithm. The execution time increased according to the look-ahead time parameter applying a cell size of 2 NM, whereas the
execution time with 3NM seems to grow with a lower rate, see Figure 20. The reason of this difference in that the time execution
is related to the trajectory discretization and the amount of data the algorithm need to process to achieve a valid solution.
87
87
195
195
284
284
466
466
610
610
17
18
24
27
45
52
78
89
86
103
2 AIRP O RTS
4 AIRP O RTS
2 AIRP O RTS
4 AIRP O RTS
2 AIRP O RTS
4 AIRP O RTS
2 AIRP O RTS
4 AIRP O RTS
2 AIRP O RTS
4 AIRP O RTS
2N
M3
NM
4N
M5
NM
6N
M
NUMBER OF CES AND PCESC
EL
L S
IZE
AN
D N
UM
BE
R O
F A
IRP
OR
TS
IN
OP
ER
AT
ION
2 VS . 4 AIRP ORTS IN OP ERATION
All detected CEs detected PCEs

Figure 20: Analysis of the look-ahead time parameter.
The number of PCE before mitigation remains equal through all experiments, which is a positive indicator that the algorithm is
capable to identify all CEs and PCEs of the selected traffic sample. The number of PCEs increases significantly applying a look-
ahead time greater than 60 minutes.
Finally, for an improved visualization of the effectiveness of the tools, a graphical illustration shows the reduction of the CEs
before and after mitigation for the selected case. The chart in Figure 21 shows the PCEs from the traffic scenario using a cell size
of 2NM, a look-ahead time of 60min and considering 2 operating airports. A total of 88% of the PCEs are solved (meaning that
from 100% of concurrence events that could have been solved, 88% were solved), which represents the 20% of the total CEs (the
88% of solved PECs represent 22% of all flights).
Figure 21: Visualization of the PCEs. The Gantt chart shows the PCEs before mitigation and after mitigation. A total of
88% of the PCEs is solved, making it 20% less probable that there is an ATC tactical intervention.
In summary, a first recommendation for operating parameters can be retrieved from these experiments. Considering the scenario
of this study case, the cell size should be set to 2NM or 3NM (depending on the available performance resources) the difference
between operating the algorithm at 2 airports or 4 airports in this case becomes significant with a larger cell size whereas the
-1,00
1,00
3,00
5,00
7,00
9,00
11,00
0
5
10
15
20
25
45 60 75 45 60 75
2 3
Min
ute
s
Num
ber
of
PC
E
Cell Size (NM) and look ahead time (min)
Look ahead time
PCE before mitigation PCE after mitigation execution time
5:55 5:56 5:57 5:59 6:00
9
8
Time
Cel
l ID
Visualisation of the PCEs after mitigation
PCE Duration
5:55 6:02 6:09 6:16 6:23 6:31 6:38 6:45 6:52 6:59
17
16
15
14
13
12
11
10
9
8
7
6
5
4
3
2
1
Time
Cel
l ID
Visualisation of the PCEs before mitigation
PCE Duration

difference between resolved concurrence events is rather small at a lower cell size. Finally, a 60-minutes look-ahead time achieves
the best results applying a cell size of 3NM.
A second set of experiments have been carried out using the recommended operating parameters. The traffic samples have been
chosen to cover a wide range of demand values (e.g. day of the week and hour of operation). A summary of the tested realistic
traffic scenarios is presented in the Table 2.
Day of traffic scenario Date of traffic scenario Hour of traffic scenario
Monday 17th of July 2017 6am to 7am
Monday 17th of July 2017 4pm to 5pm
Wednesday 19th of July 2017 6am to 7am
Wednesday 19th of July 2017 4pm to 5pm
Saturday 22nd of July 2017 6am to 7am
Saturday 22nd of July 2017 4pm to 5pm
Table 2: Realistic traffic scenarios that were chosen for the experiments
The experiments revealed that, on average, there are more PCEs that could be solved in the later afternoon, see Figure 22. On
Wednesday afternoon and on Saturday afternoon, the number of PCEs that could be solved reaches from 41% to 52%, meaning
that in the latter half of the existing total CE could be solved by the proposed algorithm, reducing the possibility of an ATC
intervention by over 50%.
During the morning hours, the traffic volume increases because air traffic is building up around the airports. As the demand
increases, the air-traffic controllers delay flight departures and take longer to sequence arriving flights. For time slots where no
such regulations are applied and a normal daily routine is performed, more possible CEs can be detected and a greater number of
CEs can be mitigated.
Figure 22: Percentage of solvable CEs (PCEs). The highest number of PCEs that could be solved is observed in the later
afternoon hours whereas busy morning hours such as Wednesday morning provide less possibility to solve CEs.
Further tests carried out to determine the most effective cell size ( �) for the parameter confirmed our initial findings. The results
on the cell size experiments are represented in Figure 23. The figure shows a clear trend that the absolute number of solved PCEs
is higher when applying a cell size of 2NM or 3NM whereas a cell size of 5NM or 6NM solves less PCEs.
38% 37%
16%
41%
31%
52%
0%
10%
20%
30%
40%
50%
60%
Monday
, 17.0
7.2
018
6:0
0-7
:00am
Monday
, 17.0
7.2
018
4:0
0-5
:00pm
Wed
nes
day
, 19.0
7.2
018
6:0
0-7
:00am
Wed
nes
day
, 19.0
7.2
018
4:0
0-5
:00pm
Sat
urd
ay, 22.0
7.2
017
6:0
0-7
:00
am
Sat
urd
ay, 22.0
7.2
017
4:0
0-5
:00pm
% s
olv
able
CE
(P
CE
s)
Traffic Scenario
% of solvable CEs

Applying a cell size of 4NM, some outliers can be observed. In some cases, the cell size of 4NM solved many CEs whereas in
other cases the results are unsatisfactory. Although the aircraft are separated with the determined safety distance, in a real context
where the operations involving safety factors tends to be more conservatively, a distance of 2NM might not help to prevent a ATC
intervention. Therefore, it is proposed the use of a cell size of 3NM as it gives steady good results throughout all experiments.
Figure 23: Summary of results of the analysis cell size. (a) It can be observed that a smaller cell size leads to more solved
CEs whereas a larger cell size resolved less CEs in absolute numbers. (b) The percentage of solved PCEs reveal similar
results. A smaller cell size leads to more solved CEs and a bigger cell size to less solved CEs. The cell size 4NM is streaked
by outliers.
The results of the traffic scenarios with respect to the analysis of the number of operating airports can be seen in Figure 24. The
numbers shown below were calculated using the mean of all traffic scenarios. The findings confirm previous results that the
difference of the number of PCEs is rather low operating in 2 or in 4 airports, however, contrary to expectations, for these
experiments, these values remain low.
0
5
10
15
20
25
30
35
Monday,
17.07.2018
6:00-7:00am
Monday,
17.07.2018
4:00-5:00pm
Wednesday,
19.07.2018
6:00-7:00am
Wednesday,
19.07.2018
4:00-5:00pm
Saturday,
22.07.2017
6:00-7:00am
Saturday,
22.07.2017
4:00-5:00pm
So
lved
PC
Es
Traffic Scenario
Analysis: Cell Size
2NM 3NM 4NM 5NM 6NM
0%
50%
100%
2NM 3NM 4NM 5NM 6NM
% s
olv
ed P
CE
sCell Size
Percentage of solved PCEs vs. all PCEs
Monday, 17.07.2018 6:00-7:00am Monday, 17.07.2018 4:00-5:00pm
Wednesday, 19.07.2018 6:00-7:00am Wednesday, 19.07.2018 4:00-5:00pm
Saturday, 22.07.2017 6:00-7:00am Saturday, 22.07.2017 4:00-5:00pm
(a) (b)
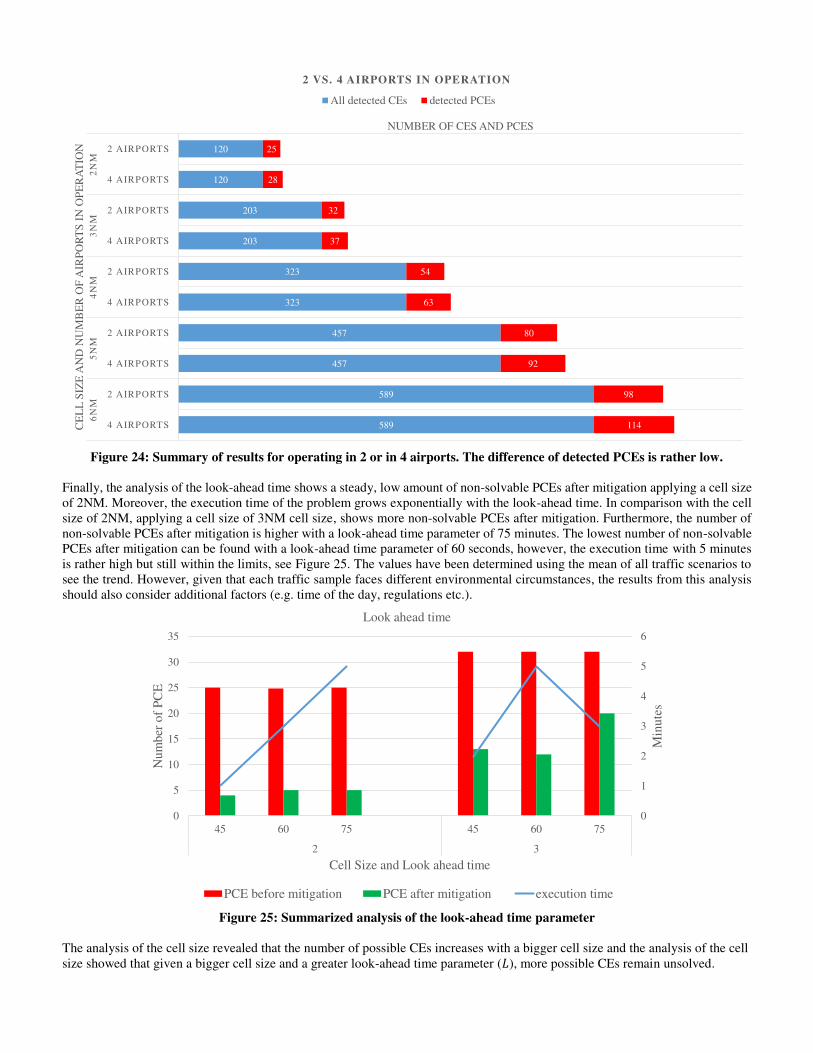
Figure 24: Summary of results for operating in 2 or in 4 airports. The difference of detected PCEs is rather low.
Finally, the analysis of the look-ahead time shows a steady, low amount of non-solvable PCEs after mitigation applying a cell size
of 2NM. Moreover, the execution time of the problem grows exponentially with the look-ahead time. In comparison with the cell
size of 2NM, applying a cell size of 3NM cell size, shows more non-solvable PCEs after mitigation. Furthermore, the number of
non-solvable PCEs after mitigation is higher with a look-ahead time parameter of 75 minutes. The lowest number of non-solvable
PCEs after mitigation can be found with a look-ahead time parameter of 60 seconds, however, the execution time with 5 minutes
is rather high but still within the limits, see Figure 25. The values have been determined using the mean of all traffic scenarios to
see the trend. However, given that each traffic sample faces different environmental circumstances, the results from this analysis
should also consider additional factors (e.g. time of the day, regulations etc.).
Figure 25: Summarized analysis of the look-ahead time parameter
The analysis of the cell size revealed that the number of possible CEs increases with a bigger cell size and the analysis of the cell
size showed that given a bigger cell size and a greater look-ahead time parameter (�), more possible CEs remain unsolved.
120
120
203
203
323
323
457
457
589
589
25
28
32
37
54
63
80
92
98
114
2 AIRPORTS
4 AIRPORTS
2 AIRPORTS
4 AIRPORTS
2 AIRPORTS
4 AIRPORTS
2 AIRPORTS
4 AIRPORTS
2 AIRPORTS
4 AIRPORTS
2N
M3
NM
4N
M5
NM
6N
M
NUMBER OF CES AND PCES
CE
LL
SIZ
E A
ND
NU
MB
ER
OF
AIR
PO
RT
S I
N O
PE
RA
TIO
N2 VS. 4 AIRPORTS IN OPERATION
All detected CEs detected PCEs
0
1
2
3
4
5
6
0
5
10
15
20
25
30
35
45 60 75 45 60 75
2 3
Min
ute
s
Nu
mb
er o
f P
CE
Cell Size and Look ahead time
Look ahead time
PCE before mitigation PCE after mitigation execution time

4 CONCLUSION AND FUTURE RESEARCH
4.1 Conclusion
A STAM-based methodology to reduce the number of ATC interventions on air has been presented. The three-step methodology,
composed by detection, analysis and mitigation, was used to develop a framework designed to be executed as a recurrent TBO
service. The S-T interdependency analysis method provide a baseline to design new metrics that could support the application of
alternative pre-tactical measures to the current MDI.
A sensitivity analysis resultant from the experiments has focused on determining suitable values for the cell size ( �), the look-
ahead time (�), while analysing different scenarios defined by the day of the week, time intervals and number of operating airports.
The trend of the parameters throughout different traffic scenarios has been consolidated during all experiments. However, in some
traffic scenarios the number of PCEs and CEs and the percentage of solvable CEs had a significant difference. During traffic peaks
(early morning hours and/or with ATC regulations), the percentage of solvable CEs was 16% whereas the possibility of solving
CEs raised to 52% in traffic scenarios with lower traffic demand (late afternoon). These findings could lead to the conclusion that
the acceptability of the methodology in different environments i.e. en-route, where traffic is less dense than in the LTMA could be
very high. However, it is required an improvement of technological support for the trajectory prediction that could guarantee
acceptable levels of uncertainty.
Significantly, the cell size parameter has showed best results when using 2NM or 3NM. However, since the cell size of 2NM could
be insufficient to prevent ATC interventions during real operations, it probably will trigger an ATC intervention before the
concurrence event is mitigated. Therefore, the use of a cell size parameter of 3NM shows the most appropriate value for the sample
of data used if the priority of the decision-makers is to cover the most quantity of concurrence events while maintaining acceptable
levels of uncertainty. The use of cell sizes of 5NM or 6NM lead to a reduced number of solved CE in exchange of a lower
uncertainty values.
The experiments show that the difference between deploying the method in 2 or 4 airports has a smaller improvement on the
mitigation of CEs. The effects of using different airports becomes significant when the number of departing flights (control
variables) increases and when the number of interdependences between trajectories of the selected airports is reduced (e.g. to avoid
redundancy in the solutions). This means that an analysis of the traffic is recommended prior selection of the airports in order to
ensure a maximum number of independent control variables (PCE) is achieved. At this end, further experiments should be
performed in order to understand the effects of different airports for different traffic samples.
Finally, the look-ahead time parameter has been evaluated. Considering the execution time needed to run the traffic scenarios with
different look-ahead time parameters and the amount of PCEs that remain unsolved after the mitigation process, the experiments
show that a look-ahead time parameter between 45 min to 60 min could be recommended. The uncertainty levels increase with the
look-ahead time. However, this parameter is also associated to other factors that prevents its reduction. The ground ATC requires
a minimum time to direct the flight to the stand-by/holding point, and depending on the taxi layout, once the push-back and start
phase is completed, changing the sequence of take-off could not be possible. Therefore, the look-ahead time is directly linked to
the airport taxi layout and the taxi times. Further analysis is required to understand the uncertainties associated to ground operations.
4.2 Future research
The methodology presented an ideal case that considered a high adherence nominal route for the reference trajectories. There are
several sources of uncertainties that should be considered when including the human-in-the-loop. The application of the algorithm
in a terminal maneuvering area support a reduction of the look-ahead time and the uncertainties associated to the take-off and
ascending phases. In a terminal airspace, exist nominal routes that provides a high 4D adherence. An analysis of the nominal routes
of a multi-airport system will reduce significantly the uncertainty levels associated to the TMA operations and support the selection
of the airports, routes and sectors for the application of this methodology. A key aspect is the use of reference trajectories that
represent the actual traffic. The analysis of historical traffic samples that determine recurrent traffic patterns will improve the
selection of cell-size and look-ahead time to guarantee reduced levels of uncertainty.
In a realistic operational scenario, the ground operation inputs an important amount of latency that is expected to be absorbed by
the skills of the ground ATC while issuing take-off clearances at the proposed ETOT. Consequently, further research is required
to understand the impact of the presented methodology on the human performance, including the push-back, taxi operations and
uncertainties associated to the typical operations of an airport (e.g. last-minute passenger delays).

The proposed method could be used to redefine the capacity values of sectors based on quantifying the events associated to ATC
interventions (e.g. a novel complexity metric targeting specific concurrence events). Further analysis is required to determine the
parameters of the algorithm that actually reduces the number of ATC interventions while including the human in the loop (a very
small cell-size could still trigger an ATC intervention on air).
The experiments presented in this paper uses the London terminal airspace as study case. However, it has been determined that the
sensitivity of the parameters and the amount of solutions are impacted by the configuration of the scenario and the traffic sample.
The application of the methodology in other multi-airport systems could help to determine the effects of the amount of traffic and
the airports involved in the effectivity of the solution.
Acknowledgment
The STAM methodology presented in this paper has been designed for the European project “cooPerative depArtuRes for a
compeTitive ATM networK sErvice” (PARTAKE) sponsored by SESAR Joint Undertaking under grant agreement No 699307
under European Union’s Horizon 2020 research and innovation programme. PARTAKE (GA Ref. Ares (2016) 838948) | SESAR
2020 Exploratory Research.
The tools have been tested and verified during the development of the project and additionally, a visual interface has been designed
to quick understanding of the state of the system, rising quickly and visually the situational awareness throughout the look-ahead
time Figure 26.
Figure 26: Dashboard visualization developed in the scope of the PARTAKE project (UAB et al. 2018)

Acronyms
ANSP Air Navigation Service Provider
ATC Air Traffic Controller
ATFCM Traffic Flow And Capacity Management
ATM Air Traffic Management
CTOT Calculated Take-Off Time
CE Concurrence Event (loss of defined separation minima)
CEs All Concurrence Events that have been detected with the detection tool
DCB Demand And Capacity Balancing
DDR2 Demand Data Repository
DFS Depth First Search
EGBB Bristol Airport
EGGD Birmingham Airport
EGGW London Luton Airport
EGLL London Heathrow Airport
EGSS London Stansted Airport
EGTTCAP LTMA Capital Sector
EGTTCPT LTMA Compton Sector
EGTTTC LTMA
EGTTVAT LTMA Vaton Sector
ETOT Estimated Take-Off Time
FL Flight Levels
LTMA London Terminal Maneuvering Area
MAS Multi Airport System
MDI Minimum Departure Intervals
PCEs Concurrence Events (CE) that could be mitigated with the mitigation tool since they fulfill the
requirements e.g. are still on the ground and could be delayed, belong to one of the airports that have
been chosen, etc.
RBT Reference Business Trajectory
SATM Aerospace Transport And Manufacturing
SDS Spatial Data Structure
SESAR Single European Sky ATM Research
SID Standard Instrumental Departures
STAM Short Term ATFCM Measures
TBO Trajectory Based Operations
TMA Terminal Maneuvering Area

REFERENCES
CAA, 2017. Aviation Trends - Q4, Available at:
http://www.caa.co.uk/uploadedFiles/CAA/Content/Standard_Content/Data_and_analysis/Analysis_reports/Aviation_trends/AviationTrends_2017_Q4(1).
pdf.
CAPITA, 2013. No 1778 – Service Order 16: UK TANS Charge Benchmarking - Consultancy Services for CAA’s Regulatory Policy Group,
CU et al., 2018. D6.2 - Report on Validation. , (February), p.66.
Eurocontrol, 2018a. Air traffic demand data | Eurocontrol. Available at: https://www.eurocontrol.int/service/air-traffic-demand-data [Accessed May 28, 2018].
Eurocontrol, 2017. Demand Data Repository (DDR) | Eurocontrol. Available at: http://www.eurocontrol.int/ddr [Accessed December 28, 2017].
Eurocontrol, 2007. HOURLY ENTRY COUNT VERSUS OCCUPANCY COUNT RELATIONSHIP DEFINITIONS AND INDICATORS (I), Available at:
https://www.eurocontrol.int/sites/default/files/library/015_Hourly_entry_vs_occupancy_count_definitions_and_indicators.pdf.
Eurocontrol, 2018b. Minimum Departure Interval - EUROCONTROL ATM Lexicon. Available at:
https://ext.eurocontrol.int/lexicon/index.php/Minimum_Departure_Interval [Accessed May 28, 2018].
Lara, D., 2005. A Benchmark and analysis of spatial data structures for physical simulations.
NATS, 2017. United Kingdom Aeronautical Information Service. Available at: http://www.nats-uk.ead-
it.com/public/index.php%3Foption=com_content&task=blogcategory&id=6&Itemid=13.html [Accessed May 28, 2018].
Netjasov, F., Janić, M. & Tošić, V., 2011. Developing a generic metric of terminal airspace traffic complexity. Transportmetrica, 7(5), pp.369–394. Available at:
http://www.tandfonline.com/doi/abs/10.1080/18128602.2010.505590 [Accessed May 28, 2018].
Next Gen Program, 2017. Next Generation Air Transportation System (NextGen). Available at: https://www.faa.gov/nextgen/ [Accessed November 13, 2017].
Nosedal, J. et al., 2014. An efficient algorithm for smoothing airspace congestion by fine-tuning take-off times. Transportation Research Part C: Emerging
Technologies, 44, pp.171–184.
Schefers, N., González, J.J.R. & Nosedal, J., 2016. An efficient constraint programming model for cooperative flight departures. In 18th International
Conference on Harbor, Maritime and Multimodal Logistics Modelling and Simulation, HMS 2016.
Sesar JU, 2017. SESAR Joint Undertaking | High performing aviation for Europe. Available at: https://www.sesarju.eu/ [Accessed November 13, 2017].
SESAR JU, 2016a. Agent. Available at: http://www.agent-aero.eu/ [Accessed January 31, 2018].
SESAR JU, 2016b. Partake. Available at: http://www.partake-aero.eu/ [Accessed January 31, 2018].
SKYbrary, 2017. 4D Trajectory Concept - SKYbrary Aviation Safety. Available at: https://www.skybrary.aero/index.php/4D_Trajectory_Concept [Accessed
November 19, 2017].
UAB et al., 2018. D8.2 - Final Project Results Report. , (February 2018), pp.1–59.
UK Department for Transport, 2013. UK Aviation Forecasts, Available at:
https://assets.publishing.service.gov.uk/government/uploads/system/uploads/attachment_data/file/223839/aviation-forecasts.pdf.


![› ko › certi › [BV] 22021_C1 BV... · 2020-06-29 · UL CB Test Certificate NO DK-66517-UL dated 18/09/2017 - UL CB/IEC Test Report NO 4787859537-3 dated 18/08/2017 4. APPLICATION](https://static.fdocuments.ec/doc/165x107/5f20edc8bf5a450d6f212b99/a-ko-a-certi-a-bv-22021c1-bv-2020-06-29-ul-cb-test-certificate-no.jpg)